 
          3394
        
        
          Proceedings of the 18
        
        
          th
        
        
          International Conference on Soil Mechanics and Geotechnical Engineering, Paris 2013
        
        
          0
        
        
          0.02
        
        
          0.04
        
        
          0.06
        
        
          Axial strain (zero before freezing)
        
        
          0
        
        
          1
        
        
          2
        
        
          3


            q


          [MPa]
        
        
          -10
        
        
          o
        
        
          C
        
        
          -5
        
        
          o
        
        
          C
        
        
          -2
        
        
          o
        
        
          C
        
        
          -1
        
        
          o
        
        
          C
        
        
          -5
        
        
          -4
        
        
          -3
        
        
          -2
        
        
          -1
        
        
          0
        
        
          1


            p


            n


          [MPa]
        
        
          0
        
        
          1
        
        
          2
        
        
          3


            q


          [MPa]
        
        
          -10
        
        
          o
        
        
          C
        
        
          -5
        
        
          o
        
        
          C
        
        
          -2
        
        
          o
        
        
          C
        
        
          -1
        
        
          o
        
        
          C
        
        
          -5
        
        
          -4
        
        
          -3
        
        
          -2
        
        
          -1
        
        
          0
        
        
          1


            p


            n


          [MPa]
        
        
          0
        
        
          5
        
        
          10
        
        
          15


            s


          [MPa]
        
        
          Yield Surface
        
        
          CSL
        
        
          -10
        
        
          o
        
        
          C
        
        
          -5
        
        
          o
        
        
          C
        
        
          -2
        
        
          o
        
        
          C
        
        
          -1
        
        
          o
        
        
          C


            E


          = 50 MPa


          = 0.3


            p


            no


            *


          = 0.15 MPa


            M


          = 1


          -


          = 0.1


            k


          = 0.33


          = 0


            r


          = 0


            Parameters


            Parametersconcerningthe mechanical model


          Young’smodulus:


            E


          = 50 MPa
        
        
          Poisson’s ratio:


          = 0.3
        
        
          Parameters f ryieldandhardening
        
        
          (seeNishimuraetal., 2009b):


            p


            no


            *


          = 0.15 MPa


            M


          = 1,


          –


          = 0.1


            k


          = 0.33,


          = 0,


            r


          = 0
        
        
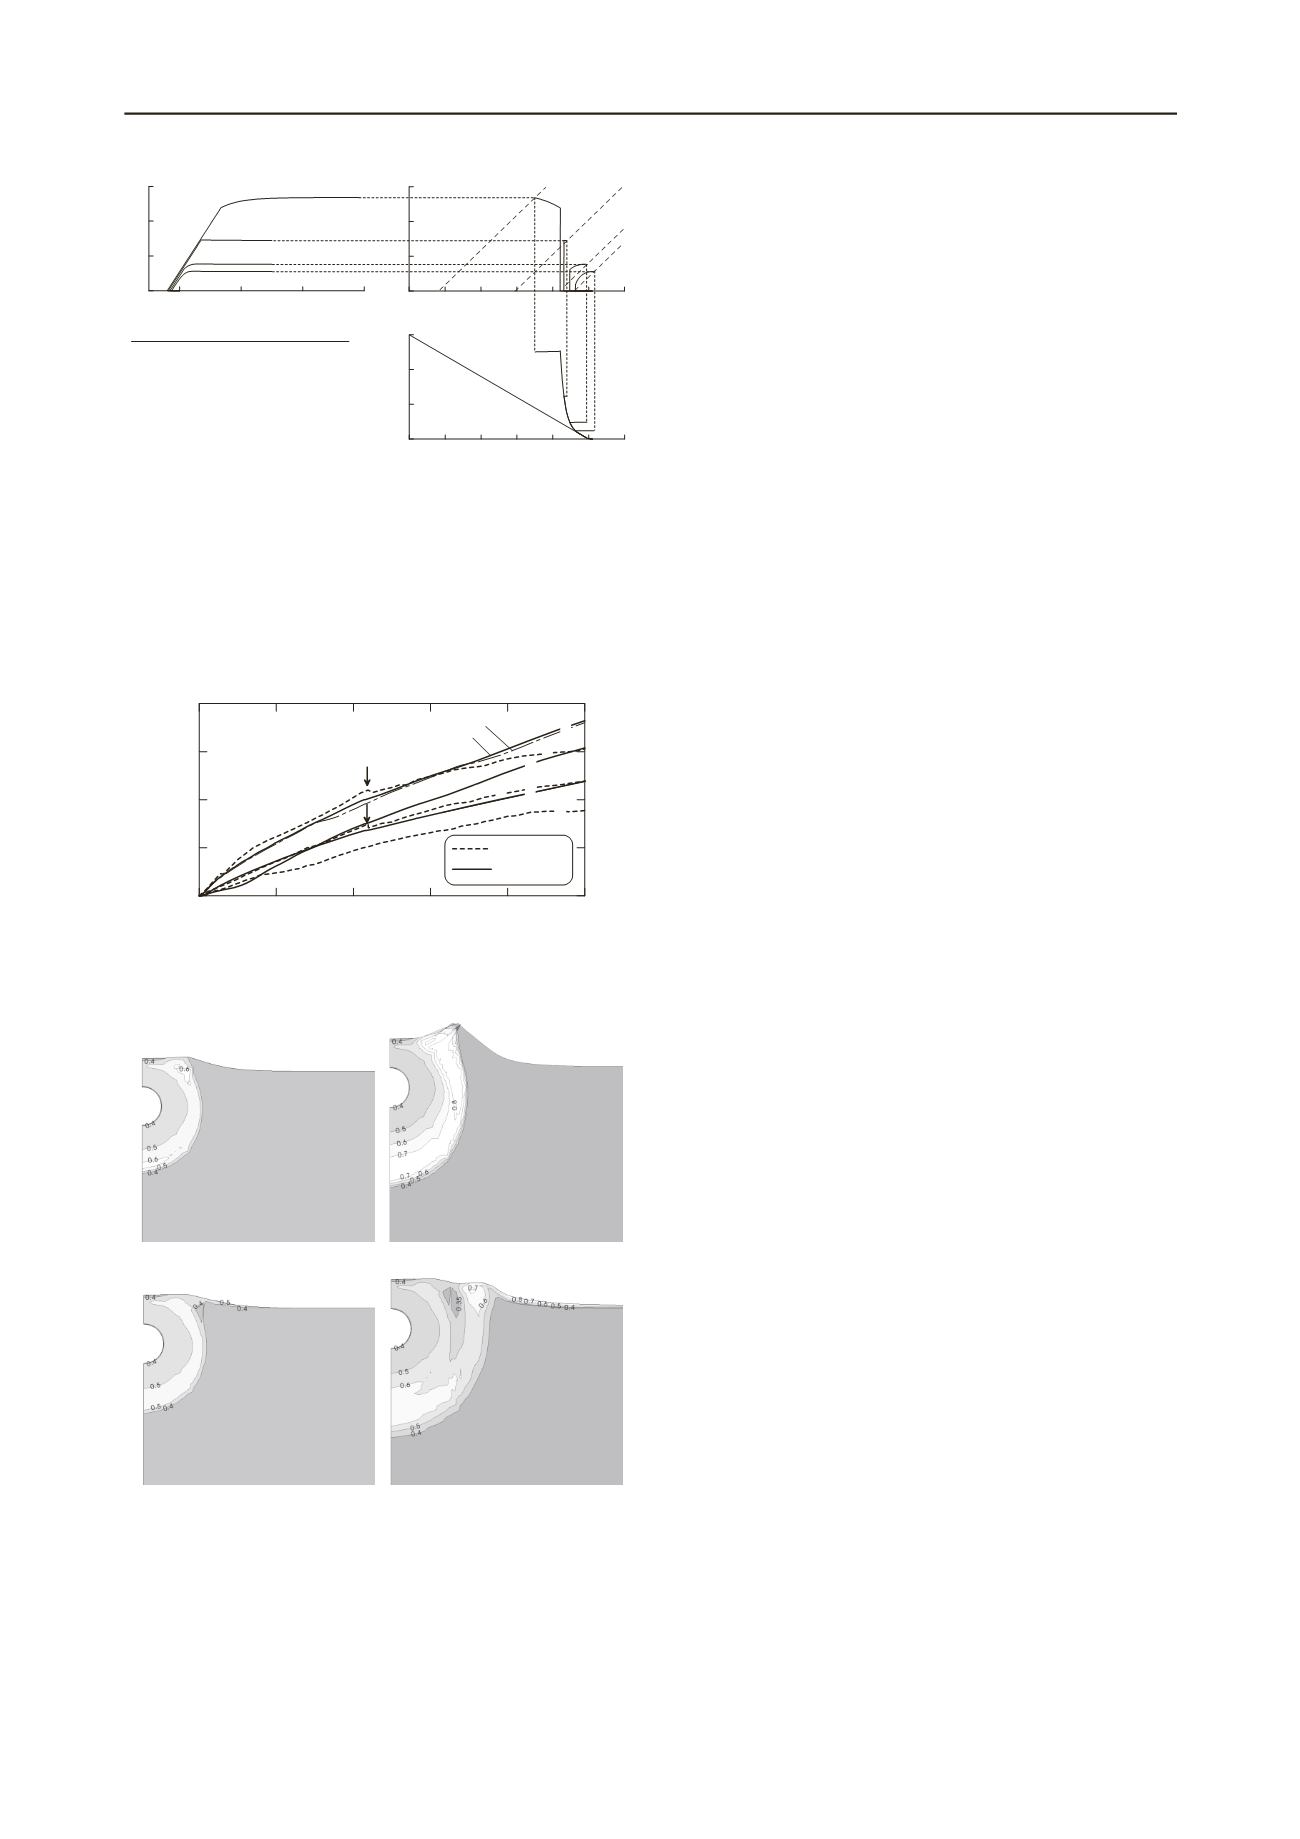
          Figure 7. Example of model performance in triaxial compression at
        
        
          different temperatures; see Nishimura et al (2009b).
        
        
          heave for the two cases, confirming the model’s ability to
        
        
          capture the field heaving behaviour. The values of input
        
        
          parameters and the processes of their determination are
        
        
          described by Nishimura et al. (2009b). The control case was
        
        
          simulated with two different scenarios for the air temperature; it
        
        
          was set either constant at +6.5
        
        
          o
        
        
          C, or varied monthly, oscillating
        
        
          between +16.5
        
        
          o
        
        
          C in July and -8
        
        
          o
        
        
          C in January.
        
        
          0
        
        
          200
        
        
          400
        
        
          600
        
        
          800
        
        
          1000
        
        
          Time [Days]
        
        
          0
        
        
          20
        
        
          40
        
        
          60
        
        
          80
        
        
          Heave of pipeline [cm]
        
        
          Observed
        
        
          Simulated
        
        
          C
        
        
          D
        
        
          Berm constructed
        
        
          D
        
        
          C
        
        
          G
        
        
          G
        
        
          Constant air temp.
        
        
          Monthly varying air temp.
        
        
          Figure 8. Computed and observed heaves of pipelines: Observation data
        
        
          from Slusarchuk et al. (1978). The ‘G’ case is a gravel-matted case; see
        
        
          the original literature for details.
        
        
          (a) Const. temp.: Day 300
        
        
          (b) Const. temp.: Day 1000
        
        
          (c) Varying. temp.: Day 300
        
        
          (d) Varying. temp.: Day 1000
        
        
          Figure 9. Computed geometry changes and porosity distributions.
        
        
          The difference in the air temperature boundary conditions
        
        
          affected the surface movement patterns, as shown in Figure 9,
        
        
          despite the limited effect on overall pipe heave. Maintaining a
        
        
          fixed temperature difference between the ground surface and the
        
        
          chilled pipeline resulted in excessively large heave away from
        
        
          the centreline and movements that could not be considered
        
        
          reliably by the model’s small-strain formulation. In the case
        
        
          with monthly variable ground surface temperature, surface
        
        
          freezing during winter disrupted the frost heave and permitted a
        
        
          more stable expansion of the frozen zones. The porosity
        
        
          distribution shown in Figure 9 indicate highly dilated, ice-rich
        
        
          areas around the pipeline, created by the influx of water drawn
        
        
          in by the ‘suction’


            P


            l


          -


            P


            i


          ,. The Calgary dataset allowed a critical
        
        
          validation of the-THM model’s realistic performance. Inputting
        
        
          longer-time, transient future local climatic/geothermal trends
        
        
          from the middle-level analyses would allow the THM analyses
        
        
          to predict the site-specific soil-structure response against
        
        
          expected climate change.
        
        
          5 CONCLUSIONS
        
        
          A multiple-level analytical framework is proposed for
        
        
          predicting soil-structure responses to climate change in those
        
        
          cold regions where permafrost degradation plays an important
        
        
          role. The framework places climate prediction at the highest
        
        
          global level, and applies AOGCM data that is downscaled and
        
        
          calibrated against local climate datasets. The next level
        
        
          combines engineering geology with non-linear 1-D modelling to
        
        
          generate extensive analytical databases from which regional
        
        
          geocryological maps may be created that both inform hazard
        
        
          mapping and strategic planning of extensive infrastructure. As
        
        
          well as providing a middle-level screening tool, the geothermal
        
        
          analysis can set the conditions for lower-level, site-specific
        
        
          engineering analyses. A new THM-model with a novel
        
        
          mechanical constitutive model has been proposed to help
        
        
          predict the complex soil-structure interactions expected as
        
        
          temperature changes encourage permafrost warming and
        
        
          degradation. The mid-level approach was checked against
        
        
          regional geothermal maps in Eastern Siberia, while the THM
        
        
          analysis was tested against field tests on chilled pipelines in
        
        
          Canada, confirming the predictions to be realistic in both cases.
        
        
          6 ACKNOWLEDGEMENTS
        
        
          The research described was funded by BP. Their support and
        
        
          permission to publish the results is sincerely acknowledged.
        
        
          7 REFERENCES
        
        
          Alonso, E.E., Gens, A. and Josa, A. 1990. A constitutive model for
        
        
          partially saturated soils.


            Géotechnique


          40 (3), 405-430.
        
        
          Clarke, J., Fenton, J., Gens, A., Jardine, R., Martin, C., Nethercot, D.,
        
        
          Nishimura, S., Olivella, S., Reifen, C., Rutter, P., Strasser, F. and
        
        
          Toumi, R. 2008. A multi-disciplinary approach to assess the impact
        
        
          of global climate change on infrastructure in cold regions,


            Proc. 9th


            Int. Conf. on Permafrost


          , Fairbanks, 279-284.
        
        
          Gens, A. 2010. Soil-environment interactions in geotechnical
        
        
          Engineering. the 47th Rankine Lecture,


            Géotechnique


          60 (1) 3-74.
        
        
          IPCC, 2007. Climate Change 2007: The physical science basis.
        
        
          Contribution of Working Group I to the Fourth Assessment Report
        
        
          of the Intergovernmental Panel on Climate Change, Cambridge
        
        
          University Press.
        
        
          Lunardini, V.J. 1978. Theory of n-factors and correlation of data.


            Proc.


            3rd Int. Conf. on Permafrost


          , Edmonton, 41-46.
        
        
          Nishimura, S. Martin, C.J., Jardine, R.J. and Fenton, C.H. 2009a. A new
        
        
          approach for assessing geothermal response to climate change in
        
        
          permafrost regions.


            Géotechnique


          59 (3), 213-227.
        
        
          Nishimura, S., Gens, A., Olivella, S. and Jardine, R.J. 2009b. THM-
        
        
          coupled finite element analysis of frozen soil: formulation and
        
        
          application.


            Géotechnique


          59 (3), 159-171.
        
        
          Slusarchuk, W.A., Clark, J.I., Nixon, J.F., Morgenstern, N.R. and
        
        
          Gaskin, P.N. 1978. Field test results of a chilled pipeline buried in
        
        
          unfrozen ground.


            Proc. 3rd Int. Conf. on Permafrost


          , Edmonton,
        
        
          878-883.