3274
Proceedings of the 18
th
International Conference on Soil Mechanics and Geotechnical Engineering, Paris 2013
(2)
1 2
0
2
t
t D C M
e
D
e
of Al is 4.77
×
10
-15
m
2
/s which was obtained by the serial
batch leaching test (Watanabe et al., 2010). As
t
1
is 0, the Eq. 2
transforms to Eq. 3, and it relates the cumulative Al release
M
exp
obtained in the triaxial tests to the elapsed time
T
.
e
DC
M
T
2
0
2
exp
4
(3)
Therefore, the transition of the internal friction angle caused
by decomposing the mechanical bridging is calculated as shown
in Table 3. Approximate 1.3% decrease in the internal friction
angle supposedly causes during 38 years.
4.2 Shear strength transition addressing decomposition of
organic matter
The organic matter decomposition of DWS as a subgrade
material is able to be interpreted as following, assuming aerobic
and unsaturated condition. Jenny (1941) described the decrease
in soil organic matter as Eq. 4.
rX
dt
dX
(4)
where
X
is the mass of organic matter and
r
is the rate of
decomposition. A solution of Eq. 4 is given by Eq. 5.
rt
e X X
0
(5)
Assuming aerobic biodegradation, discharged CO
2
is
originated from the carbon loss of decomposed organic matter
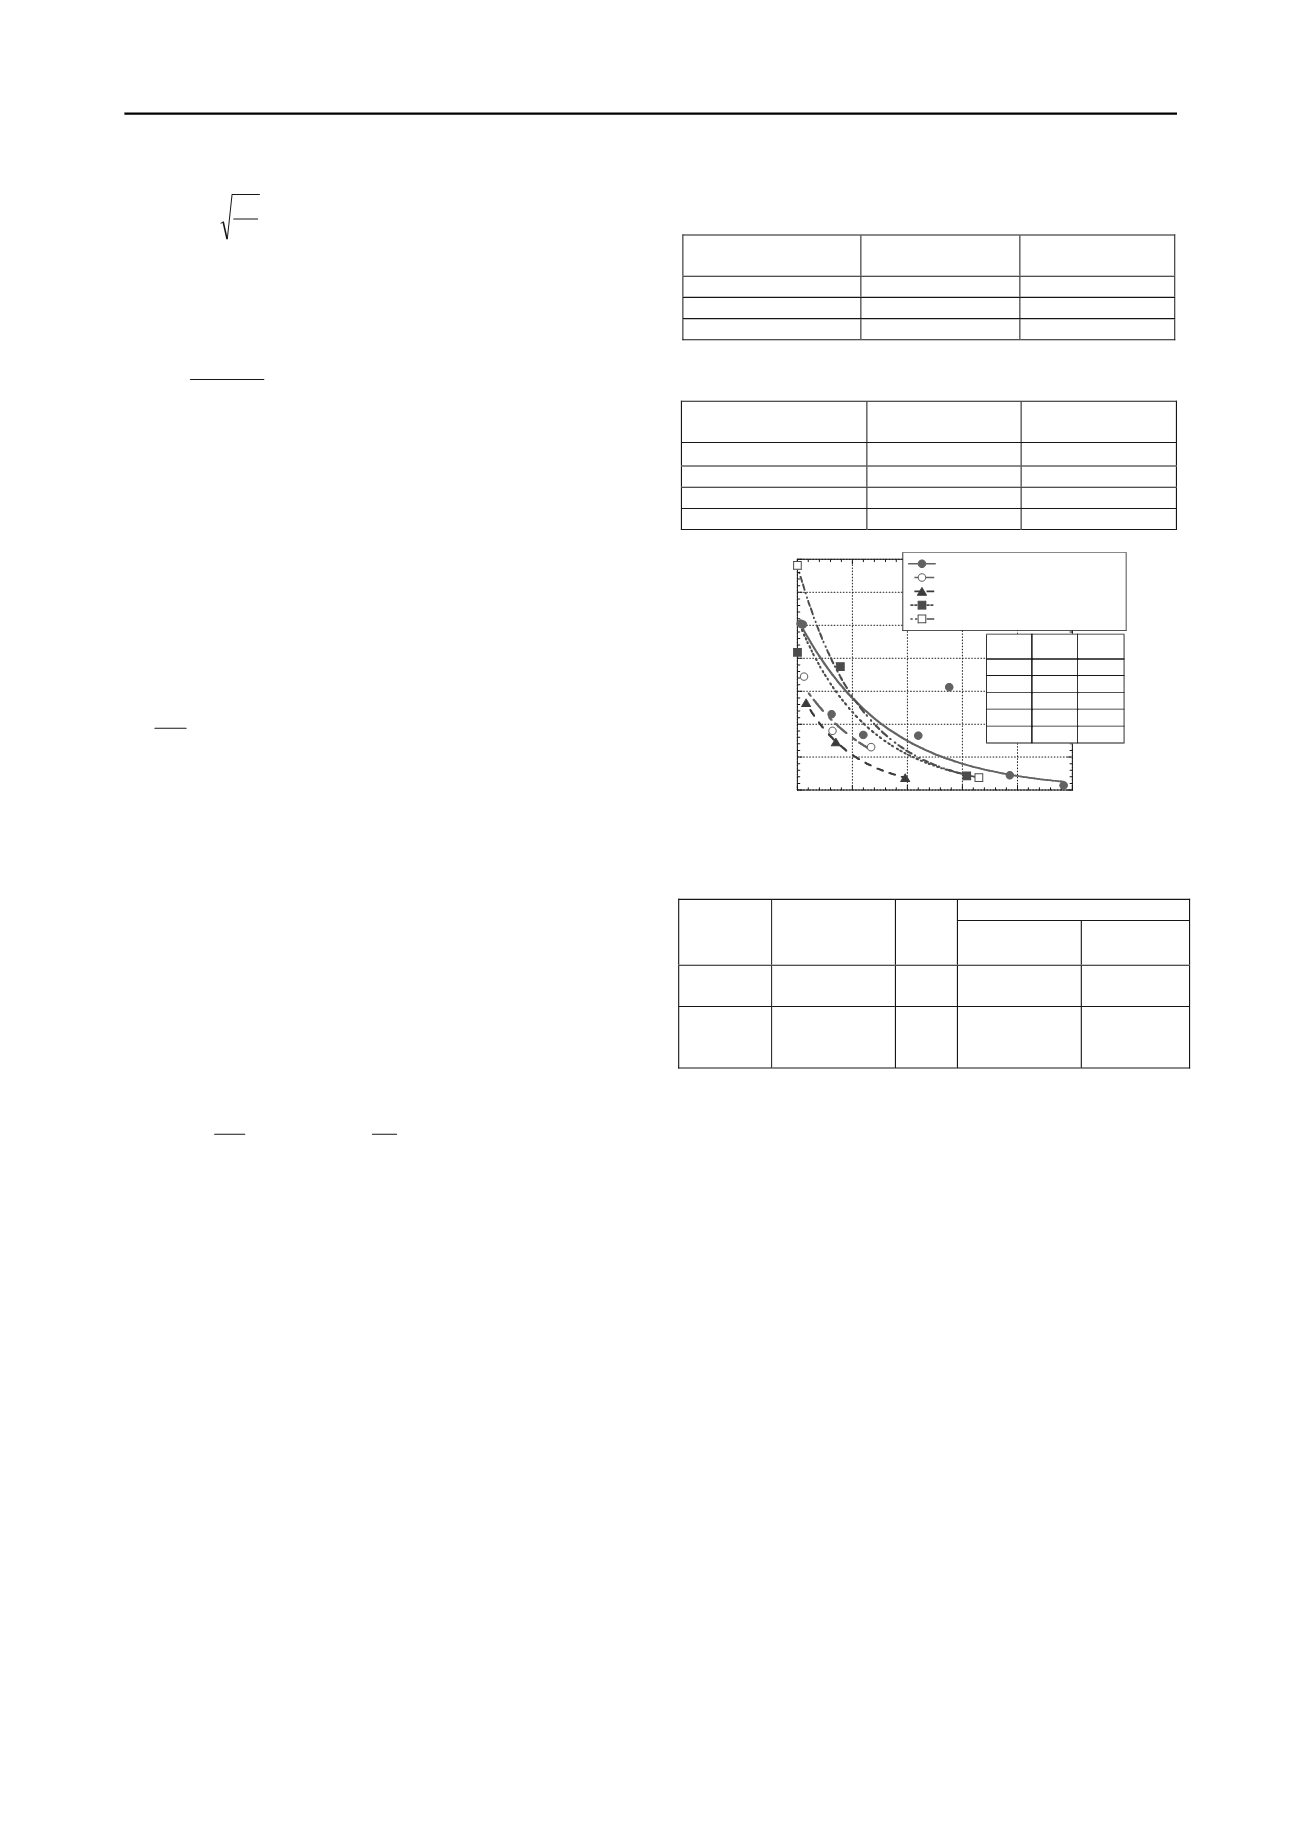
approximately. From the results of constant temperature storage
in aerobic condition of DWS (Watanabe et al., 2011),
r
is
determined by fitting Eq. 5 into the experimental data as shown
in Fig. 8. The daily CO
2
discharge during organic matter
decomposition corresponds to the decomposition mass of
organic matter, so the time integral of Eq. 5 approximately
represents the total mass of decomposed organic matter
Q
dec
.
44
12
2
1
0
rt
et
dec
e
e
r
X Q
(6)
Calculation results for the transition of the internal friction
angle caused by decomposing the organic matter are listed in
Table 4. Approximate 3.1% decrease in the internal friction
angle by organic matter decomposition causes during 22 days in
aerobic condition. Assumption of aerobic condition is not
suitable for practice, so this study confirmed the organic matter
decomposition in site. In the experimental construction that
DWS was used as a backfill material of water pipe construction,
the DWS layer was taken a position of -0.4 to -0.9 m depth
under asphalt surface. The compaction degree was approximate
64
―
76%. The monitoring term was 19 months. As shown in
Table 5, ignition loss slightly decreased at the end of the
experiment. It is presumed that organic matter decomposition
slowly progressed in contrast to the constant temperature
storage because of anaerobic condition and lower temperature.
The proposed method with aerobic condition excessively
estimates the degradation in contrast of underground conditions.
5 CONCLUSIONS
DWS is the aggregation of clay and organic compounds.
Focusing on the chemical bonding by flocculating agent and
organic matter, a simplified method for the prediction of
changes in shear strength of DWS in geotechnical works was
proposed. The decomposition of the mechanical bridging and
the organic matter was described based on diffusion-controlled
Al leaching and aerobic biodegradation, respectively. The
methodology proposed in this paper is significant to encourage
safe geotechnical utilizations through estimations of the usable
term for not only DWS but also available waste or by-products.
Table 3. Shear strength transition addressing decomposing the
mechanical bridging.
Cumulative
Al release
(mg/kg)
Calculated
elapsed time (y)
Internal friction
angle (deg.)
0
0
37.2
0.130
17.4
37.6
0.192
38.0
36.7
Table 4. Shear strength transition addressing decomposing the
organic matter.
Decomposition rate of
organic matter (%)
Calculated
elapsed time (d)
Internal friction
angle (deg.)
0
0
38.8
0.14
2
39.2
0.79
12
38.5
1.38
22
37.6
0
500
1000
1500
2000
2500
3000
3500
0
50
100 150 200 250
1: DWS-F(clod size: 2 - 19mm)
2: DWS-F(clod size: less than 2 mm)
3: DWS-G(clod size: 2 - 19mm)
4: DWS-S (clod size: 2 - 19mm)
5: DWS-S (clod size: less than 2 mm)
Daily CO
2
discharge (mg/kg/d)
Elapsed time (d)
r
X
0
CASE
-0.0125
2607.1
1
-0.0155
1725.1
2
-0.0215
1563.9
3
-0.0157
2589.8
4
-0.0175
3408.0
5
Figure 8. Results of constant temperature storage in aerobic condition of DWS (Watanabe
et al., 2011).
Table 5. In-situ monitoring results of ignition loss of DWS
Ignition loss (%)
Compaction
degree
(%)
CBR
(%)
before
construction
19 months
later
Air-dried
DWS
75.9
38.1
16.9
16.6
Filter-
pressed
DWS
64.3
55.3
24.7
24.0
REFERENCES
1) Jenny, H. (1941):
Factors of soil formation
, McGraw-Hill, New
York.
2) Mitchell, J. K. and Soga, K. (2005):
Fundamentals of Soil
Behavior
, third edition, John Wiley & Sons, Inc.
3) Montgomery J. M. (1985):
Water Treatment Principles and Design
,
John Wiley & Sons Inc., pp.116-134.
4) Ohkubo, N., Yagi, O., and Okada, M.: Effects of humic and fulvic
acids on the growth of microcystis aeruginosa,
Environmental
Technology
, Vol. 19, pp. 611-617, 1998.
5) Roque, A. J. and Carvalho, M. (2006): Possibility of Using the
drinking water sludge as geotechnical material,
Proc. of 5
th
International Congress of Environmental Geotechnics
, pp.1535–
1542.
6) Watanabe, Y. et al. (2009): Environmental impact assessment of
drinking water sludge,
Journal of Japan Society of Civil
Engineering G
, Vol. 65, No. 3, pp. 188-201.
7) Watanabe, Y. et al. (2010): Serial Batch Leaching Test for
Evaluating Degradation of Drinking Water Sludge in Geotechnical
Reuse,
Proc. of 6
th
International Congress of Environmental
Geotechnics
, pp.1073-1078.
8) Watanabe, Y. et al. (2011): Composition and decomposition of
organic matter of drinking water sludge,
Proc. of 9
th
Geo-
Environmental Engineering
, pp. 435–438.


