3268
Proceedings of the 18
th
International Conference on Soil Mechanics and Geotechnical Engineering, Paris 2013
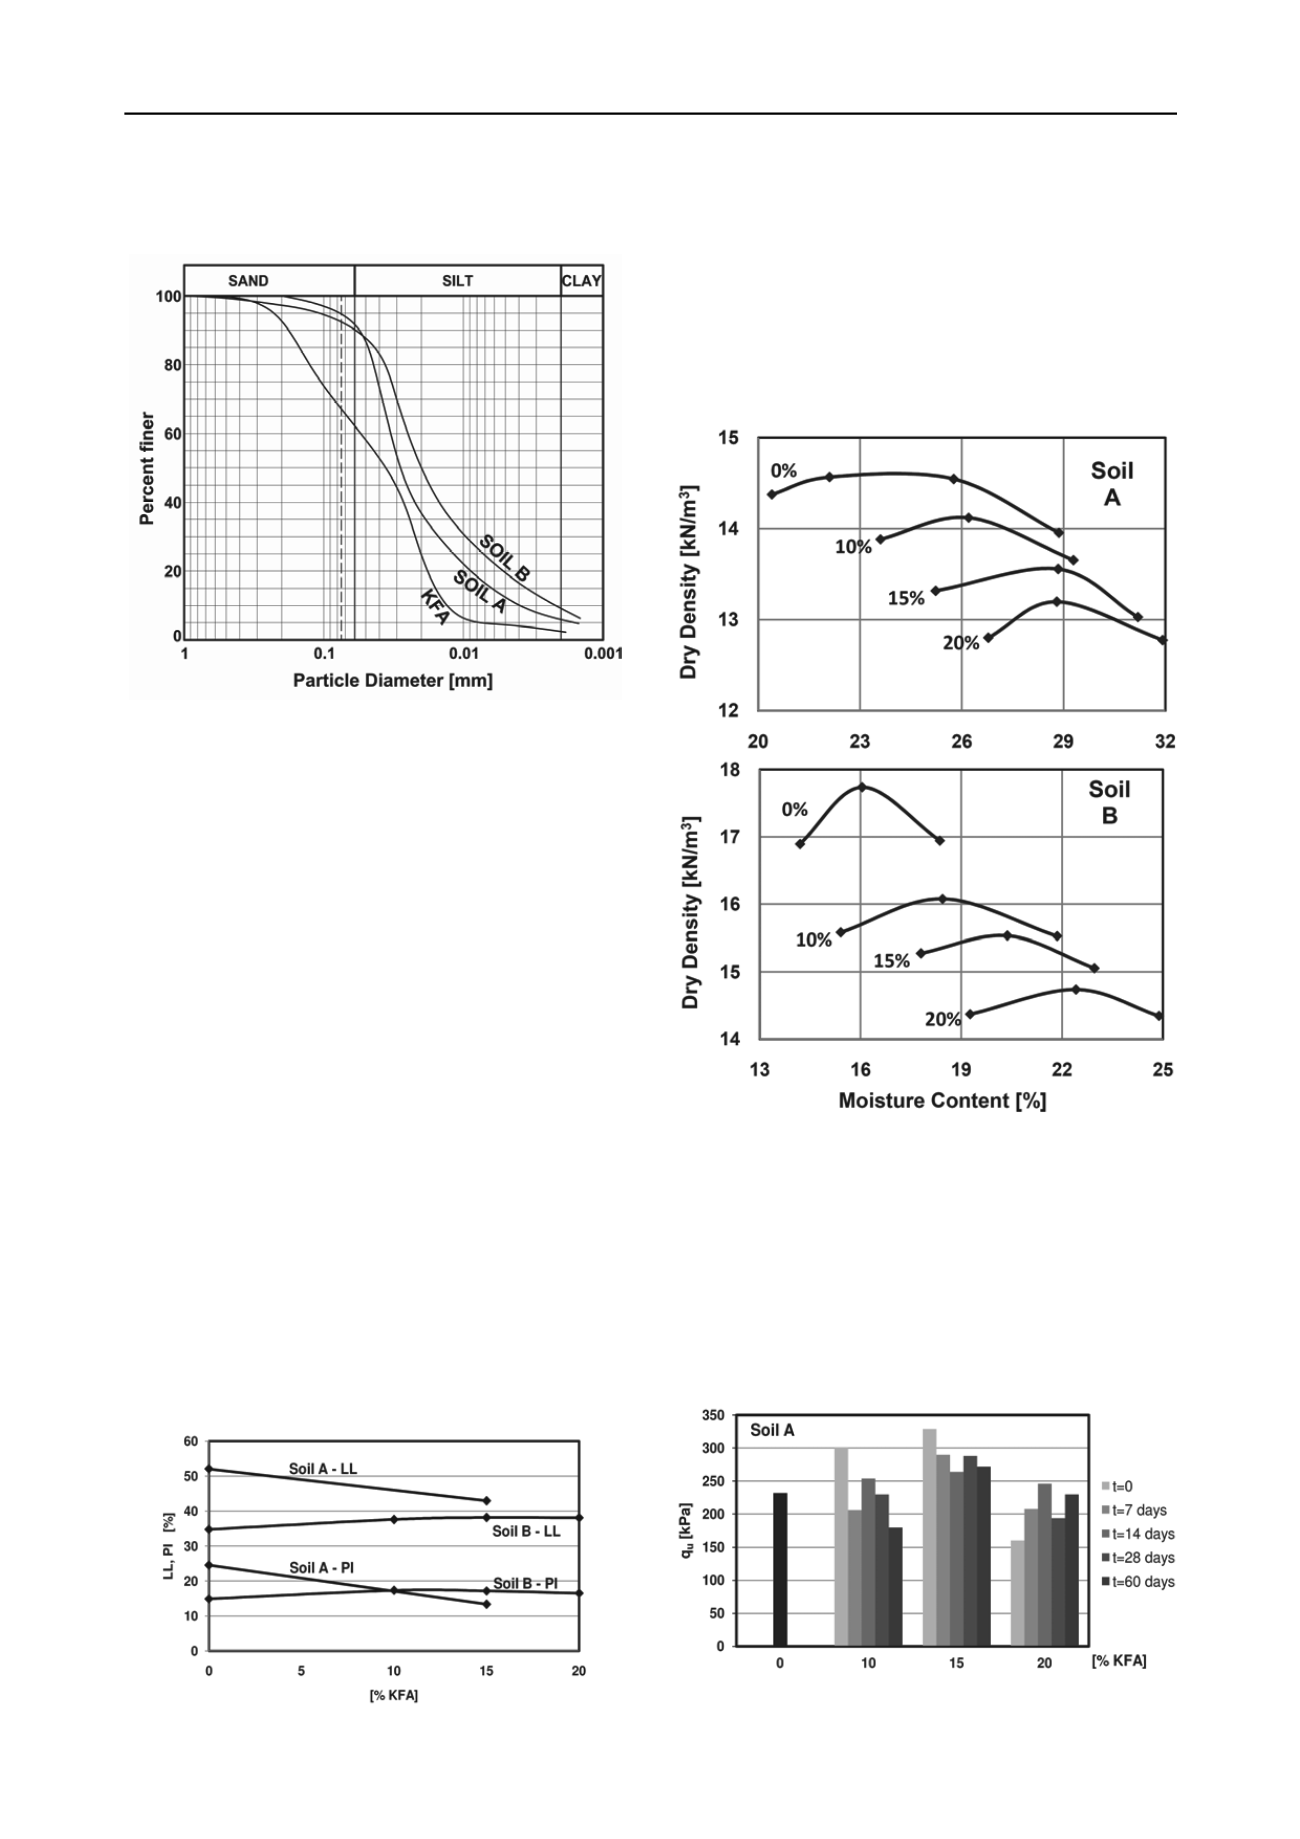
clay (CL). Grain size distribution curves for used materials are
given in Figure 1.
Figure 1. Grain size distribution curves
3
LABORATORY TESTING
Laboratory testing was conducted in the Laboratory for soil
mechanics at Faculty of Civil Engineering in Belgrade. Testing
samples were prepared by compaction, with moisture content
equal to optimum moisture content from standard Proctor
compaction test.
Fly ash soil mixtures were prepared at three fly ash-soil
ratios (10, 15, 20% fly ash content by dry weight). After
addition of water, mixtures were compacted without delay.
According to (Terrel et al. 1979, Ferguson and Leverson 1999)
compaction should start immediately after the mixing process
and finish within a maximum of 2 hours. Samples were tested
immediately after compaction (t=0), as well as after 7, 14, 28
and 60 days. Following engineering properties were determined:
unconfined compression strength (UCS), California bearing
ratio (CBR), effective shear strength parameters (c’,
’) and
compressibility modulus (M
v
). All tests were performed
according to SRPS Standards.
4
RESULTS AND DISCUSSION
4.1
Soil plasticity
In case of medium to high plasticity soil (soil A), it is observed
that increasing of KFA percentage results in decreases in the
liquid limit and plasticity index, which is not the case for low
plasticity soil (soil B), as shown in Fig. 2.
Figure 2. Variation in Atterberg limits for mixtures at t=0
4.2
Compaction
The results (Fig. 3) indicate that maximum dry density
decreases and optimum moisture content increases as the fly ash
content increases (for both soil types). The decrease in
maximum dry density is associated with the fact that used fly
ash has much lower weight than soil. Results are in line with
Santos et al. 2011 and Sharma 2012, while
opposite trend can
be found for Class C fly ash stabilization (White et al. 2005 and
Ramadas and Kumar 2012).
Figure 3. Moisture-density relationship of fly ash-soil mixtures
4.3
Unconfined Compressive Strength (UCS)
Increased soil strength is the main indicator of the successful
soil stabilization. In previous studies (Ferguson and Leverson
1999, Ferguson 1993, Parsons 2002, Edil et al. 2006) strength
of soil is usually determined by uniaxial compression test or
bearing ratio test. The results of UCS tests shown in Fig. 4
indicate that maximum strength gain for soil A is obtained for
mixture with 15% KFA. Soil UCS is increased by 15-25%,
dependent of elapsed time.
Figure 4. Strength gain of soil A for different percentages of KFA


