 
          3264
        
        
          Proceedings of the 18
        
        
          th
        
        
          International Conference on Soil Mechanics and Geotechnical Engineering, Paris 2013
        
        
          3 23.


            d


          Table 1. Material’s symbols
        
        
          Material
        
        
          %  Soil
        
        
          % MSW fly ash
        
        
          Symbol
        
        
          Soil
        
        
          100
        
        
          0
        
        
          S
        
        
          MSW fly ash
        
        
          0
        
        
          100
        
        
          CV
        
        
          Mixture 1
        
        
          60
        
        
          40
        
        
          S60/CV40
        
        
          Mixture 2
        
        
          80
        
        
          20
        
        
          S80/CV20
        
        
          1


            k k k RM


            r


            d


            RM


            3.2 Experimental tests


            3.2.1 Chemical and physical characterization


          Tests such as X-Ray Fluorescence, Organic Matter Content,
        
        
          Lixiviation and Solubilization; Granulometric Analysis and
        
        
          Atterberg’s Limit, MCT Test and Proctor Compaction Test
        
        
          were conducted.


            3.2.2 Resilient modulus test


          The tests were performed according to standardized test in the
        
        
          Geotechnical Laboratory of Federal University of Rio de
        
        
          Janeiro, into molds of 10 x 20 cm compacted at optimum
        
        
          moisture obtained in the compaction test.
        
        
          In the cyclic load triaxial test, deviator stresses are applied in
        
        
          the sample top, always in the compression direction, furthering
        
        
          a load and unload, whereas the minor principal stress remains
        
        
          constant.
        
        
          Each sample was subjected to eighteen stresses states were
        
        
          applied, with principal minor stress ranging from 0,021 to 0,137
        
        
          MPa and deviator stress ranging from 0,021 to 0,412 MPa.
        
        
          The Resilient Modulus (M
        
        
          R
        
        
          ) of soil is the relationship
        
        
          between the deviator stress (σ
        
        
          d
        
        
          ) applied repeatedly in a sample
        
        
          of soil in triaxial test and the corresponding specific recoverable
        
        
          or resilient strain (ε
        
        
          r
        
        
          ). As shown in Equation 1 (AASHTO
        
        
          TP46-94 1996).
        
        
          (1)
        
        
          Where:
        
        
          M
        
        
          R
        
        
          :  resilient modulus;
        
        
          σ
        
        
          d
        
        
          :  cyclic deviator stress (σ
        
        
          1
        
        
          - σ
        
        
          3
        
        
          );
        
        
          ε
        
        
          r
        
        
          : resilient strain (vertical).
        
        
          The composite model used in this study relates the resilient
        
        
          modulus of minor principal stress and deviator stress, as shown
        
        
          in Equation 2.
        
        
          (2)
        
        
          Where:
        
        
          σ
        
        
          3
        
        
          : minor principal stress;
        
        
          σ
        
        
          d
        
        
          : cyclic deviator stress (σ
        
        
          1
        
        
          - σ
        
        
          3
        
        
          );
        
        
          k
        
        
          1
        
        
          , k
        
        
          2
        
        
          and k
        
        
          3
        
        
          : correlation coefficients, derived from results of
        
        
          laboratory tests.
        
        
          This model was chosen because it presents bigger correlation
        
        
          coefficients to the incorporating the minor principal stress and
        
        
          the deviator stress influence. The nonlinear least squares model
        
        
          estimation was utilized to obtain the correlation coefficients.
        
        
          In order to evaluate the influence of cure time, optimal water
        
        
          content samples were prepared and next rolled into hermetically
        
        
          closed plastic bags for 7 and 21 days. Soon afterwards, these
        
        
          were proceeded to the resilient modulus tests.


            3.2.3 Permanent deformation test


          The tests were performed according to Guimarães (2009), using
        
        
          the same molds used in the Resilient Modulus Test. A total of
        
        
          500,000 load cycles were applied for each specimen.
        
        
          Three tests were conducted in the Mixture S60/CV40,
        
        
          in the condition of maximum dry density, at stress levels shown
        
        
          in Table 2.
        
        
          Table 2. Permanent deformation tests
        
        
          Test Number
        
        
          σ
        
        
          3
        
        
          (MPa)
        
        
          σ
        
        
          d
        
        
          (MPa)
        
        
          1
        
        
          0,098
        
        
          0,294
        
        
          2
        
        
          0,118
        
        
          0,353
        
        
          3
        
        
          0,098
        
        
          0,392


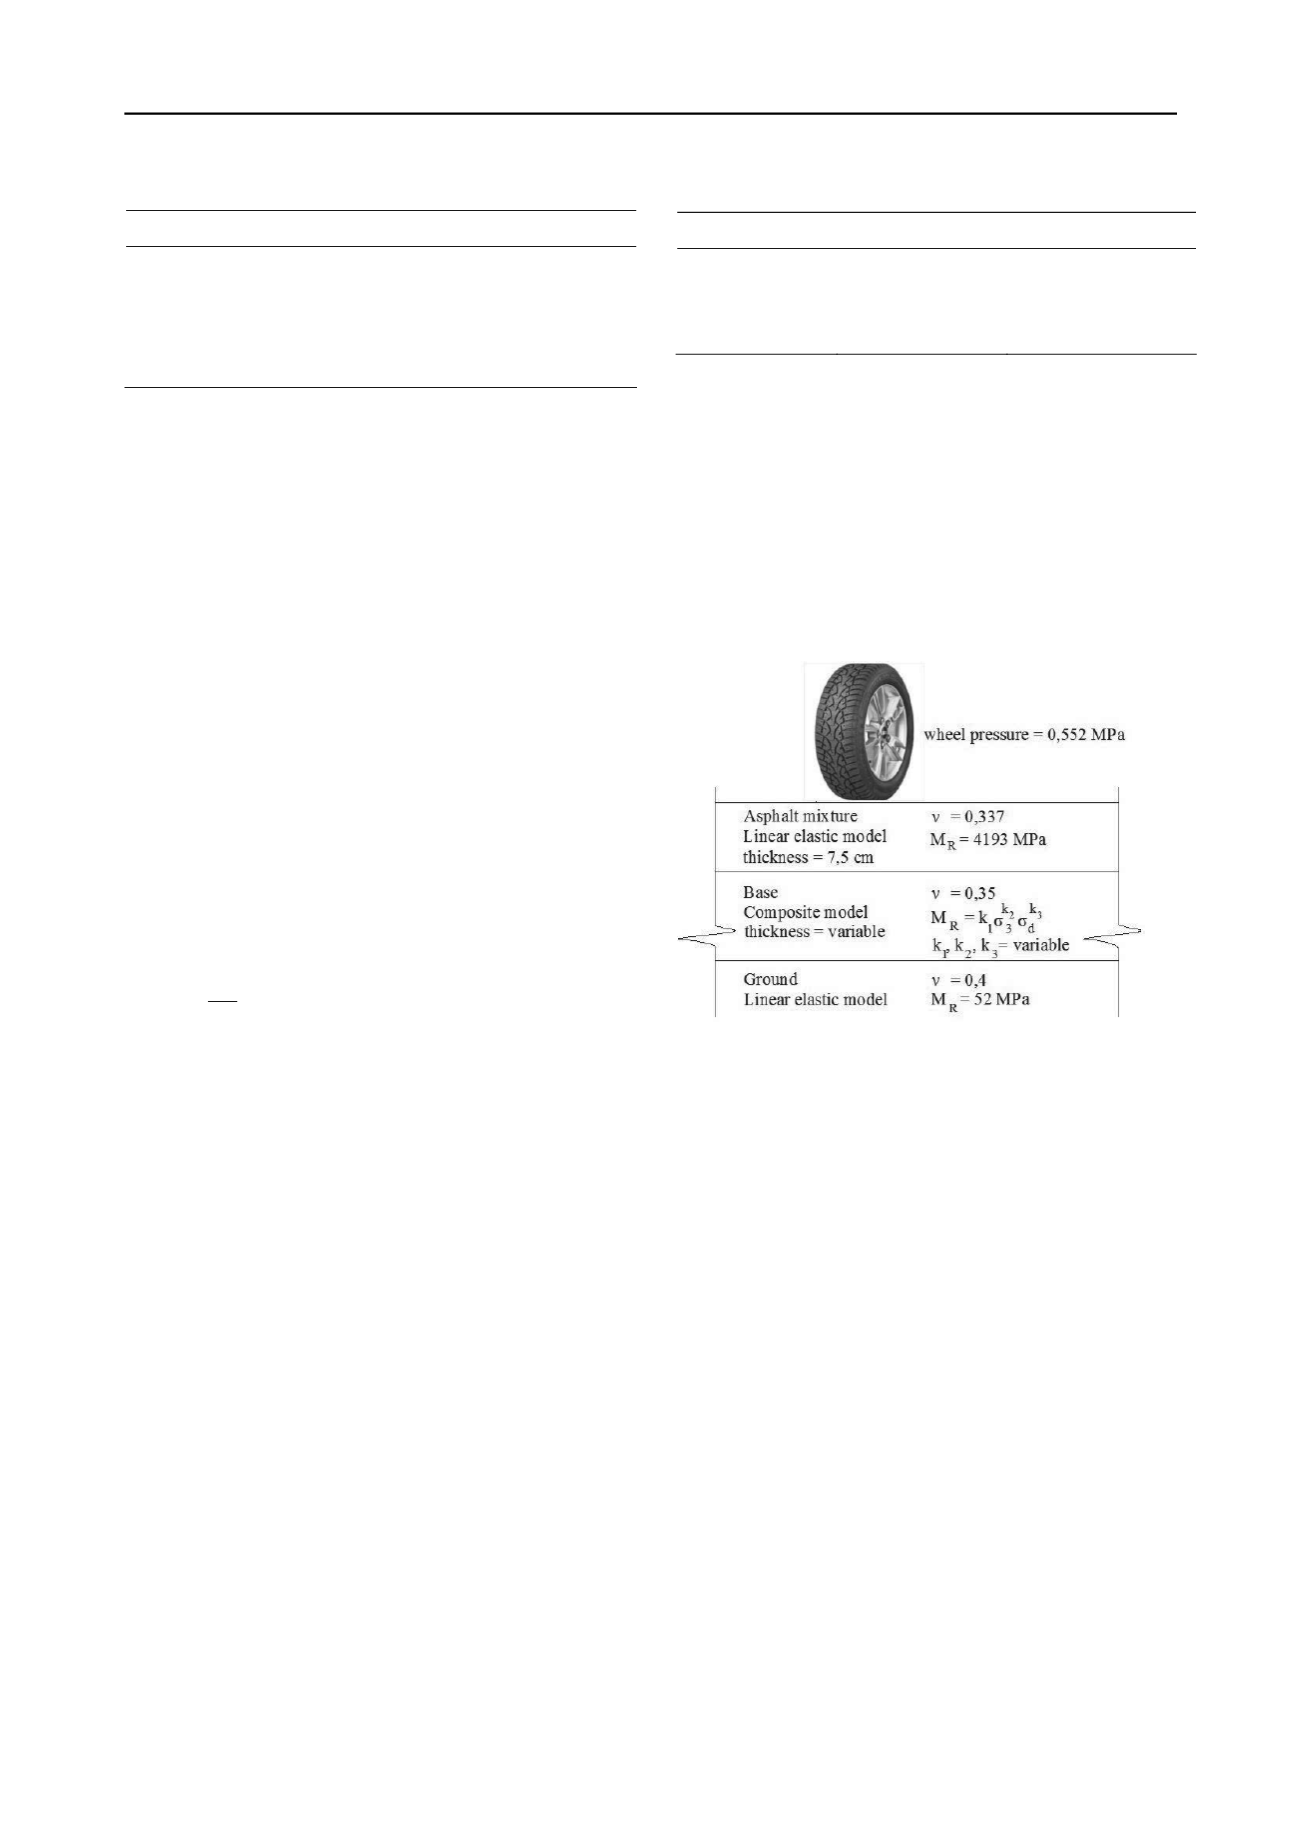
            3.2.4 Pavement design


          A pavement structure was assumed (Figure 1) considering Rio
        
        
          de Janeiro’s weather, with the purpose of exploring the effects
        
        
          of adding MSW fly ash in soil on pavement project one. The
        
        
          thickness and mechanical properties of the coated asphalt and
        
        
          subgrade remain constant, so that only the the thickness of the
        
        
          base may be modified, according to the parameters of resilience
        
        
          for each material. As for the mechanistic-empirical analysis, the
        
        
          computer program SisPav (Franco, 2007) was used. Bernucci
        
        
          (1995) indicates for Brazilian low traffic roads an N value of
        
        
          10
        
        
          4
        
        
          to 10
        
        
          6
        
        
          should be used. Thus, in this study, N value of 10
        
        
          5
        
        
          was assumed.
        
        
          Figure 1. Pavement structure adopted.
        
        
          4 RESULTS AND DISCUSSIONS
        
        
          From the test conducted, the characteristics and effects of the
        
        
          addition of MSW Fly Ash into soil were studied.


            4.1 Chemical characterization


          The main chemical components of soil, which are normally
        
        
          found in residual soils, are SiO
        
        
          2
        
        
          , Al
        
        
          2
        
        
          O
        
        
          3
        
        
          and Fe
        
        
          2
        
        
          O
        
        
          3
        
        
          , such as
        
        
          showed in the Table 3. Lixiviation and Solubility tests
        
        
          performed according to Brazilian standards NBR 10005 and
        
        
          NBR 10006 for MSW fly ash and soil stabilized with 40% fly
        
        
          ash content. The mixture is classified non - dangerous and non-
        
        
          inert (Vizcarra 2010).


            4.2 Physical characterization


          MSW fly ash and mixtures can be noted as follows: first, the
        
        
          Atterberg Limits for pure MSW fly ash could not be performed
        
        
          due to the behavior of granular material, which during the test
        
        
          did not show plastic characteristics to their achievement.
        
        
          Second, the inclusion of MSW fly ash decreases the liquid limit
        
        
          and plasticity index, and increases the plastic limit of soil.
        
        
          According the classification MCT (Nogami & Villibor
        
        
          1995), the soil is classified as NG’ behavior "non-lateritic-clay."
        
        
          When compacted under the conditions of optimum moisture
        
        
          content and maximum dry unit weight for normal energy
        
        
          compaction, these soils present characteristics of traditional
        
        
          highly plastic and expansive clays.
        
        
          The use of these soils is related to restrictions resulting from
        
        
          its high expansibility, plasticity, compressibility and contraction