3256
Proceedings of the 18
th
International Conference on Soil Mechanics and Geotechnical Engineering, Paris 2013
maximum and minimum void ratio of 0.85 and 0.54
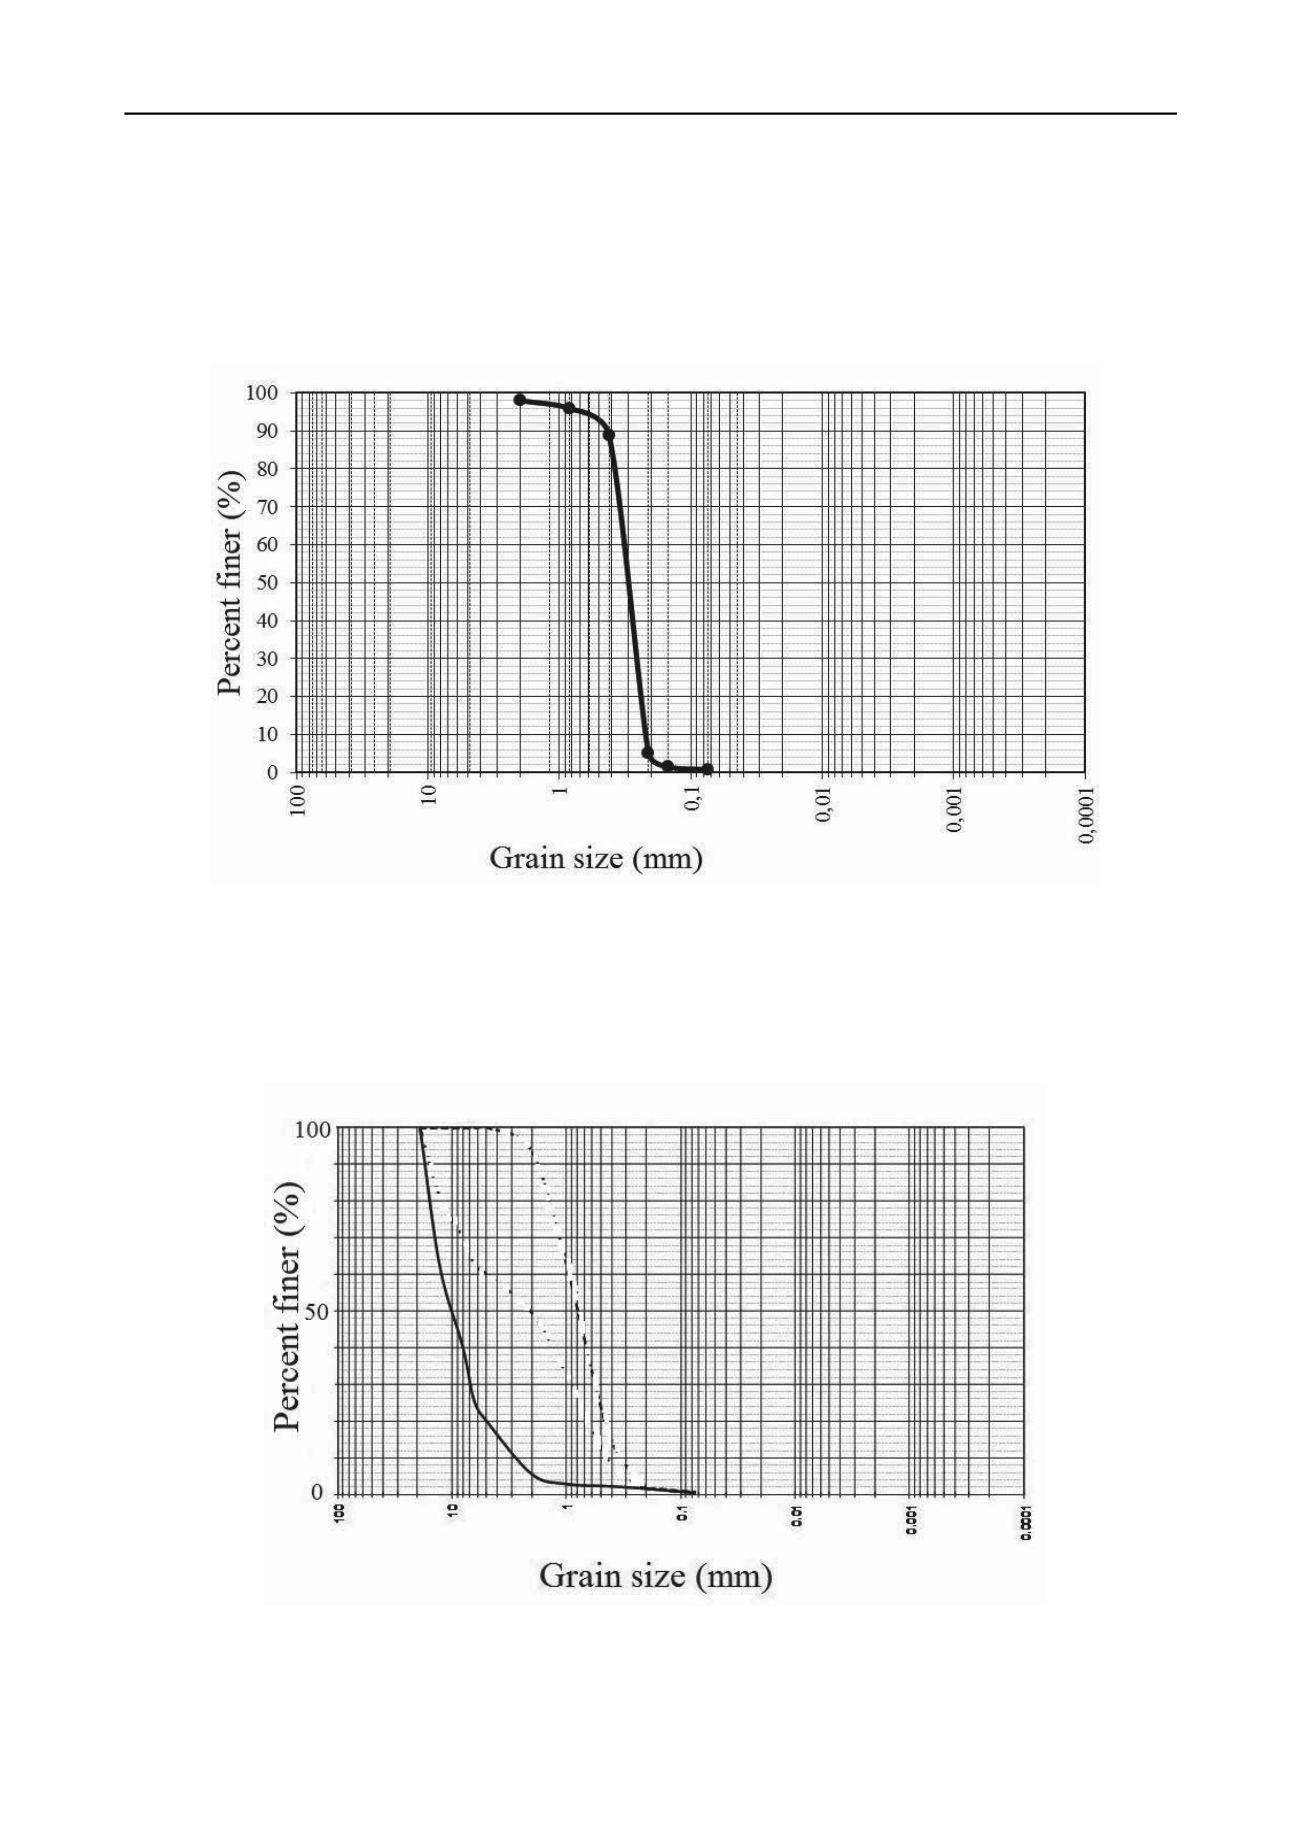
respectively. D
60
of the sand used is 0.35mm and the internal
friction angle was found 41. Considering the weight proportions
of cement and glass foam, mixtures with different weight ratios
of cement, which is used as the binding material, and glass
foam, which is regarded as the main component having the
largest volume ratio in the mixture, were prepared. Cement and
water were mixed first, sand was added next if denoted in the
design, and after these components make up a rather
homogenous mixture, glass foam is added to the mixture and
stirred till homogeneity again.
Figure 1. Grain size distribution curve for the sand used in the experiments.
When the 7-day experimental results of the mixtures that
were produced using different sand ratios was examined, it has
been observed that the optimum results were exhibited by the
specimens which has equal sand and glass foam quantity and
when cement over foamed sand mixture ratio is two. The
water/cement ratio used is 0.45. Figure 2 shows the grain size
distribution curve for the glass foam used in the experiments.
The average value of the saturated unit weight of the glass foam
mixture was found as 8.83 kN/m
3
.
Figure 2. Grain size distribution curve for the glass foam used in the experiments.
Figure 3 shows the cement, sand and glass foam mixture
sample used in the unconfined compression test. The average
value of the typical 7-day unconfined compression strength of
the mixture was determined as 0.75 MPa while the average of
the 28-day unconfined compressive strength was 0.91 MPa.
Figure 4 shows the results of these tests, as can be seen from the
figure with time the strength of the sample increases. The CBR


