3265
Technical Committee 307 /
Comité technique 307
when subjected to drying, its use is not recommended for base
pavements, and some of the worst soil for the purpose of
paving, from the tropical soils (Nogami & Villibor 1995).
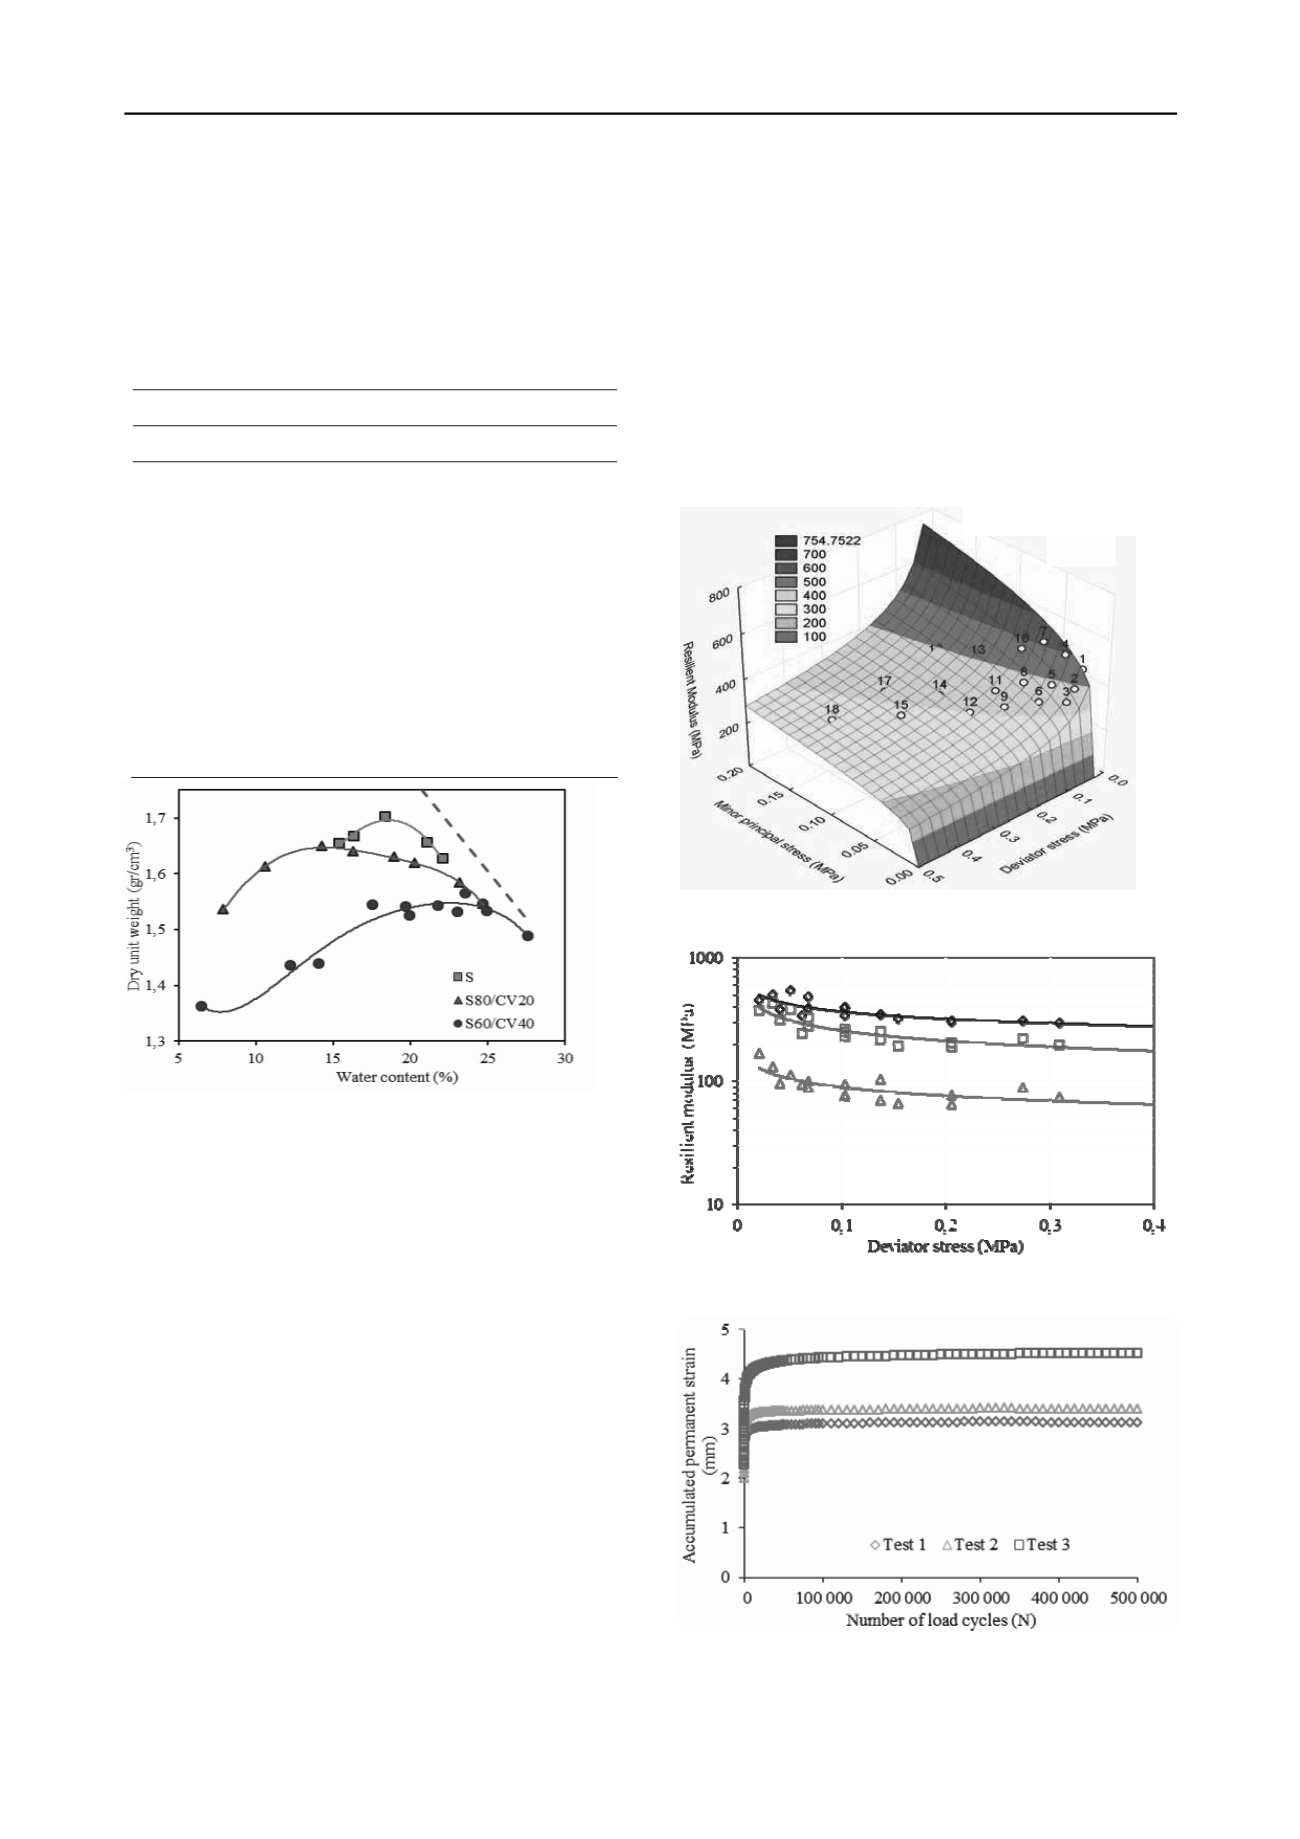
From the curves of soil compaction and mixtures with fly
ash obtained from the Modified Proctor tests, it can be stated
that by increasing the level of ash in the mixture, the maximum
dry density tends to decrease (Figure 2).
Table 3. Soil, MSW fly ash chemical composition
Concentration (%)
Compost
Soil
MSW Fly Ash
SiO
2
36 - 43
13 - 21
Al
2
O
3
35 - 38
12 - 15
Fe
2
O
3
13 - 21
5 - 7
SO
3
0 - 1
5 - 10
CaO
-
32 - 45
TiO
2
0,9 - 1,7
3 - 4
K
2
O
2 - 4
2 - 4
Cl
-
4 - 6
Organic Matter
0,1
0,7
Figure 2. Compaction Curves of Soil and 20% - 40% Soil – Fly Ash
Mixtures
4.3 Effect of MSW fly ash addition on resilient modulus
The results of Resilient Modulus tests (Figure 3) show that the
Resilient Modulus of soil in study is dependent on the deviator
stress and if the MSW fly ash is added, this behavior does not
change. It is appreciated that the higher the deviator stress, the
lower the value of resilient modulus.
The mixture with 20% MSW fly ash improved the
mechanical behavior of pure soil, the mixture with 40% MSW
fly ash downgraded the mechanical behavior, but it improved
with cure time (Figure 4).
The mixture with 20% MSW fly ash was assessed with
several different water contents. The results indicated the
resilient modulus increased as the water content decreased.
4.4 Effect of MSW fly ash addition on permanent
deformation
As shown in the Figure 5, the permanent deformation tends to
stabilize reaching a plateau, it´s observed that Test 3 has a
higher permanent deformation, this is due to increased tensions
applied to the test.
The resilient modulus is increased with the number of load
cycles (Figure 6), this can be explained by the diminution of
elastic strain. The occurrence of the plastic accommodation (i.e.
Shakedown) was investigated by using the behavior model
developed by Dawson and Wellner, cited by Werkmeister
(2003). The test results of permanent deformation test for the
MSW fly ash – soil mixture were obtained and are displayed by
the graph model of Dawson and Wellner cited by Werkmeister
(2003) in Figure 7.
By analysis of this Figure it appears that all tests conducted
with the MSW fly ash – soil mixture show a typical behavior
for level A, i.e., demonstrated plastic accommodation,
depending on the model proposed by Werkmeister (2003). The
characterization of the level A behavior of both the shape of the
curve, roughly parallel to the vertical axis, because when the
rate of permanent deformation increase and have reached a
magnitude of 10
-7
(x 10
-3
m/load cycle). I.e. at the final load
cycles, the specimen´s permanent deformation increased by
only 10 mm at each new cycle.
34,0 21,0
3 19, 311
d
RM
80,0 2
R
Figure 3. Soil with 40% MSW Fly Ash Resilient Modulus vs. Stresses
(21 days of cure)
Cure time 21 days
Cure time 7 days
Without cure time
Figure 4. Resilient Modulus vs. Stress of Soil with 40% MSW Fly Ash
– Cure Time Variation.
Figure 5. Accumulated Permanent Deformation Variation.


