 
          2962
        
        
          Proceedings of the 18
        
        
          th
        
        
          International Conference on Soil Mechanics and Geotechnical Engineering, Paris 2013
        
        
          and residual soils from gneiss. Figure 2 illustrates the local
        
        
          subsoil, without the Transitional Clay and the residual soils.
        
        
          Eolic deposits were always present in the area, including Santo
        
        
          Amaro Island and Santos City Plain. Their weights were
        
        
          responsible for the higher values of SPT, ranging from 2 to 4 as
        
        
          well as the overconsolidation of the deposits.
        
        
          0 50 100 150 200 250
        
        
          Pressures (kPa)
        
        
          0
        
        
          5
        
        
          10
        
        
          15
        
        
          20
        
        
          25
        
        
          0
        
        
          5
        
        
          10
        
        
          15
        
        
          20
        
        
          25
        
        
          z - Depth (m)
        
        
          WT
        
        
          Soft Clay
        
        
          (SFL)


          '
        
        
          vo


          '
        
        
          p
        
        
          Odometer
        
        
          Sand
        
        
          Mangrove
        
        
          Clayey Sand
        
        
          115+4.9z CPTU
        
        
          Clay and
        
        
          Sand
        
        
          (SFL)
        
        
          0
        
        
          500 1000 1500
        
        
          qt  (kPa)
        
        
          0
        
        
          5
        
        
          10
        
        
          15
        
        
          20
        
        
          25


          q
        
        
          t
        
        
          =b.


          z
        
        
          (a)
        
        
          (b)
        
        
          q
        
        
          t
        
        
          (M )
        
        
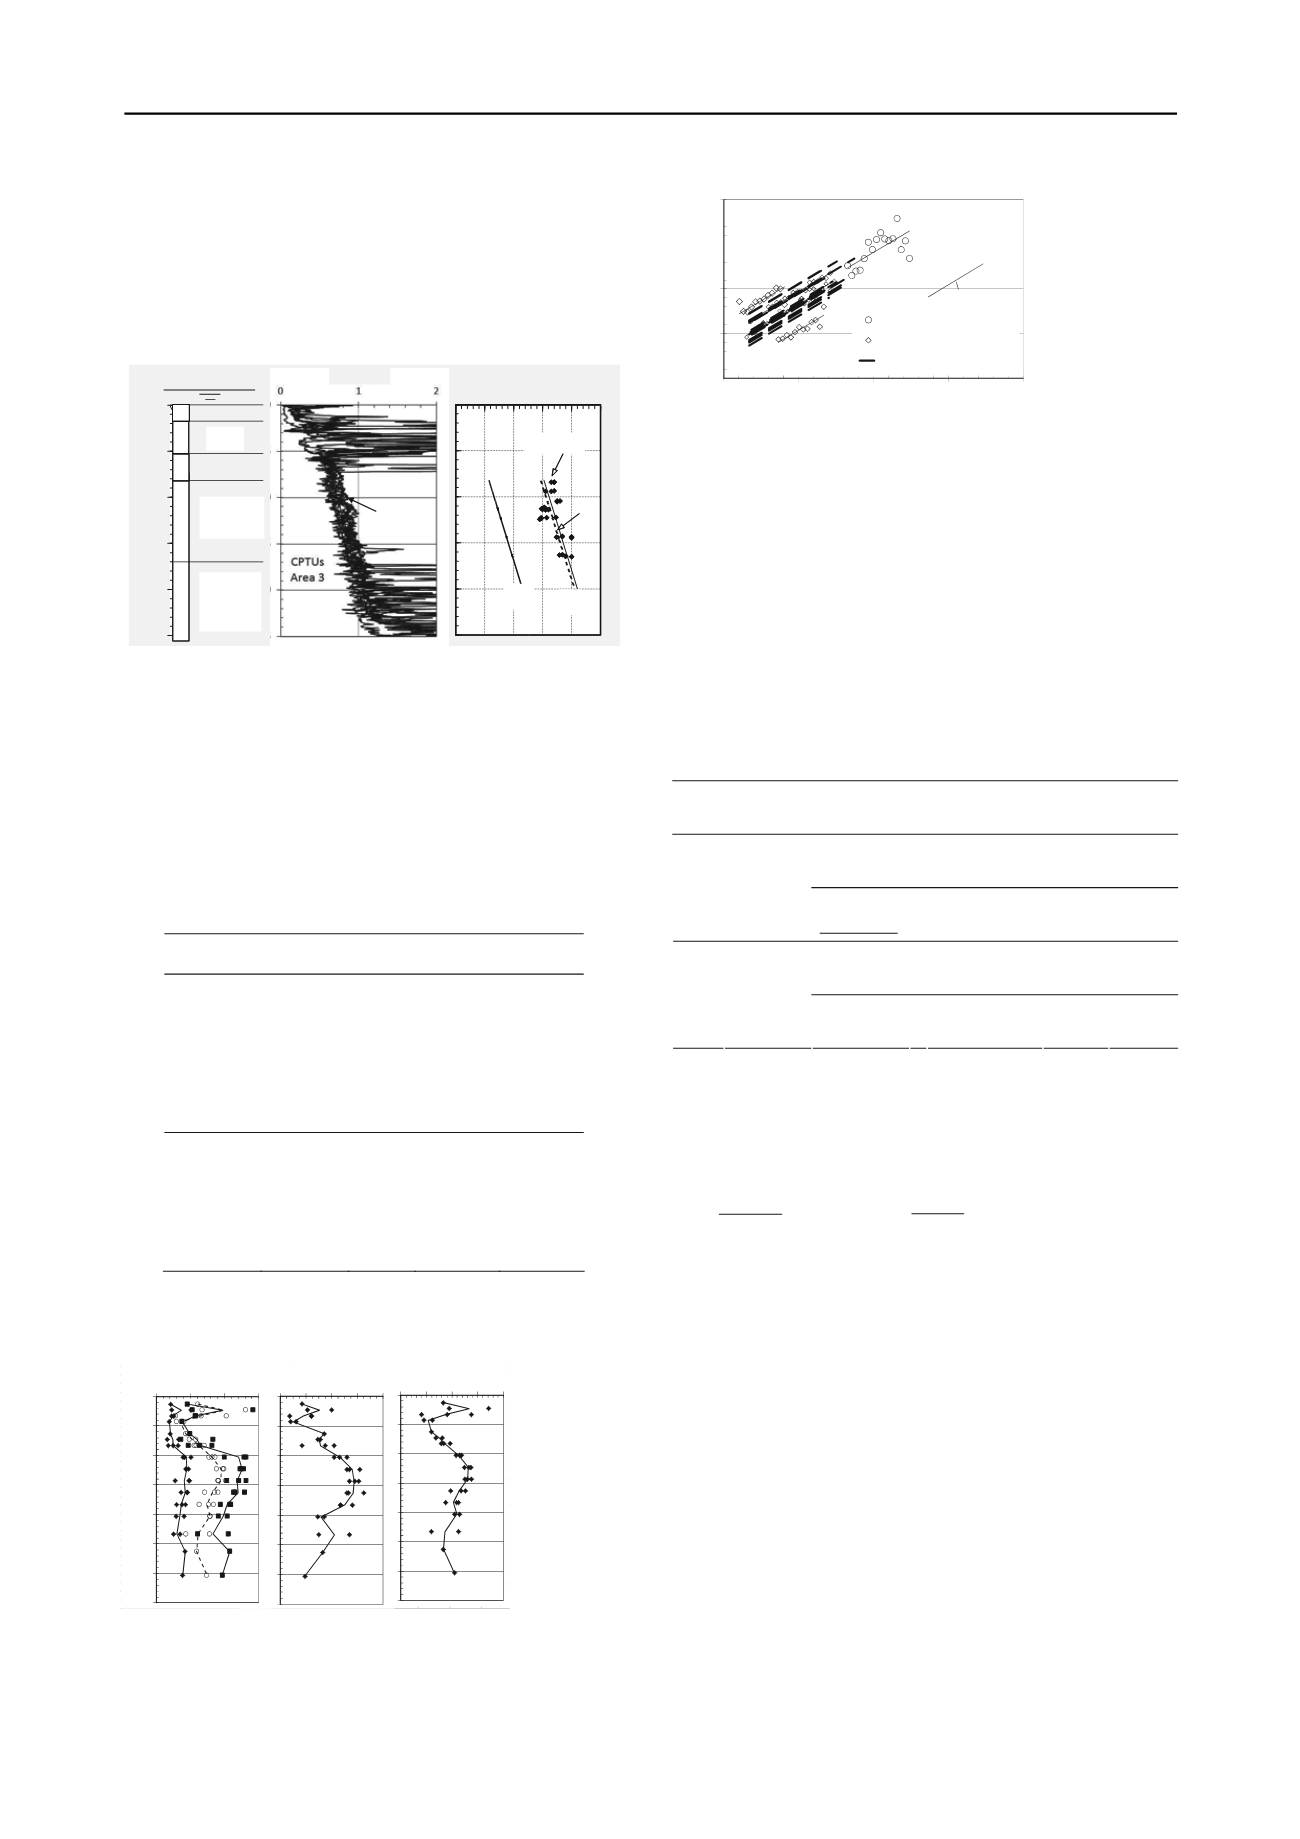
          Figure 2. Odometer tests vs. 7 CPTUs at Area 3 of Figure 1.
        
        
          The main properties of the marine clays are presented in Table
        
        
          1, separated in two parts: the upper one emphasizes the
        
        
          differences and the lower one stresses the similarities. As it can
        
        
          be seen, their index properties are almost the same and they
        
        
          differ in their “state properties”, like undrained shear strength,
        
        
          void ratio and SPT. It is interesting to mention that negative


            B


            q


          values were observed for the Pleistocene Clays, whose
        
        
          preconsolidation, with high OCR, was confirmed by
        
        
          consolidation tests on undisturbed samples (Massad 2009-a).
        
        
          Table 1.Properties of the Marine Holocene  and Pleistocene Clays
        
        
          Group
        
        
          Item
        
        
          Man-
        
        
          grove
        
        
          SFL
        
        
          AT
        
        
          Depth(m)


          5


          50
        
        
          20-45
        
        
          SPT
        
        
          0
        
        
          0-4
        
        
          5-25
        
        
          B
        
        
          q
        
        
          -
        
        
          0.4-0.9
        
        
          -0.1-0.2
        
        
          Differences q
        
        
          t
        
        
          (MPa)
        
        
          -
        
        
          0.5-1.5
        
        
          1.5-2.0
        
        
          e
        
        
          >4
        
        
          2-4
        
        
          <2


          ’
        
        
          p
        
        
          (kPa)
        
        
          <30
        
        
          30-200
        
        
          200-700
        
        
          OCR
        
        
          1
        
        
          1.1-2.5
        
        
          >2.5
        
        
          s
        
        
          u
        
        
          (kPa)
        
        
          3
        
        
          10-60
        
        
          >100


          n
        
        
          (kN/m
        
        
          3
        
        
          ) 13.0
        
        
          13.5-16.3 15.0-16.3
        
        
          %<5


          -
        
        
          20-90
        
        
          20-70
        
        
          w
        
        
          L
        
        
          40-150
        
        
          40-150
        
        
          40-150
        
        
          Similarities I
        
        
          P
        
        
          30-90
        
        
          20-90
        
        
          40-90
        
        
          C
        
        
          c
        
        
          /(1+e
        
        
          o
        
        
          )
        
        
          0.36
        
        
          0.43
        
        
          0.39
        
        
          Cr/Cc(%)
        
        
          12
        
        
          8-12
        
        
          9
        
        
          R
        
        
          f
        
        
          (%)
        
        
          -
        
        
          1.5-4.0
        
        
          1.5-2.0
        
        
          Legend: SI Symbols used
        
        
          Data from 3 borings in Area 3 are presented in Figure 3.
        
        
          0
        
        
          5
        
        
          10
        
        
          15
        
        
          20
        
        
          25
        
        
          30
        
        
          35
        
        
          0 1 2 3 4
        
        
          z - Depth (m)
        
        
          Void ratio
        
        
          0
        
        
          5
        
        
          10
        
        
          15
        
        
          20
        
        
          25
        
        
          30
        
        
          35
        
        
          0 20 40 60 80
        
        
          z - Depth (m)
        
        
          Clay Content (%)
        
        
          0
        
        
          5
        
        
          10
        
        
          15
        
        
          20
        
        
          25
        
        
          30
        
        
          35
        
        
          0 50 100 150
        
        
          z - Depth (m)
        
        
          Water Content (%)
        
        
          w
        
        
          p
        
        
          w w
        
        
          l
        
        
          Figure 3. Data from 3 borings (SS110; SS115;SS120) in Area 3.
        
        
          0
        
        
          100
        
        
          200
        
        
          300
        
        
          400
        
        
          0
        
        
          100
        
        
          200
        
        
          300
        
        
          400


          ´
        
        
          p
        
        
          (kPa)
        
        
          s´vo (kPa)
        
        
          Santos City
        
        
          SLF - Sto. Amaro Island
        
        
          SFL - EMBRAPORT
        
        
          45
        
        
          o
        
        
          Figure 4.


          ’
        
        
          p
        
        
          from CPTUs as a function of the


          ’
        
        
          vo
        
        
          .
        
        
          About 20 stress history profiles, from odometer tests and
        
        
          CPTUs, carried out in sites of the Santos Plain, like Figure 2,
        
        
          showed that equation (1) holds;


            C


            1


          and


            C


            2


          are constants.


            1


            vo


            p


            C '


            '


          or


            z'.


            C '


            2


            p


          (1)
        
        
          Figure 4 illustrates its validity and Table 2 shows values of


            C


            1


          for the 4 Classes of SFL Clays (Massad 2009-a). These findings
        
        
          have a practical consequence: more than 12 experimental earth
        
        
          fills settled in a wide range of values


            (


            EOP


          =1 to 12%) and of
        
        
          velocities (


            c


            v


            c


            h


          ~3.10
        
        
          -3
        
        
          to 5.10
        
        
          -2
        
        
          cm
        
        
          2
        
        
          /s), depending on


            OCR


          .
        
        
          Note that for the SFL clays c
        
        
          v


          c
        
        
          h
        
        
          (Massad 2009-a).
        
        
          Table 2.Classes of Holocene Clays (SFL). Santos Coastal Plain
        
        
          Class
        
        
          Clay
        
        
          Profile
        
        
          Site
        
        
          Consolidation
        
        
          Mechanism
        
        
          OCR


          ’
        
        
          p
        
        
          -


          ’
        
        
          vo
        
        
          (c
        
        
          o
        
        
          )kPa
        
        
          1
        
        
          Baixada
        
        
          Santista
        
        
          Neg. Sea
        
        
          level Osc.
        
        
          1.3-2.0
        
        
          20-30
        
        
          (5-20)
        
        
          2
        
        
          Out-
        
        
          cropping St.Amaro I
        
        
          Embraport.
        
        
          Dune
        
        
          Action
        
        
          >2.0
        
        
          50-120
        
        
          (25-45)
        
        
          3
        
        
          Santos
        
        
          City
        
        
          Neg. Sea
        
        
          level Osc
        
        
          1.0-1.3
        
        
          15-30
        
        
          (10-30)
        
        
          4
        
        
          Beneath
        
        
          8-12m of
        
        
          sand layer
        
        
          Santos
        
        
          City
        
        
          Dune
        
        
          Action
        
        
          >1.4
        
        
          40-80
        
        
          (>35)
        
        
          Legend: SI Symbols used; stresses and c
        
        
          o
        
        
          (of Eq. 3) in kPa;
        
        
          For the SFL clays of Santos Coastal Plain there is a linear
        
        
          increase of


            q


            t


          with depth, with a rate b. Massad (2009-b) used
        
        
          this fact and equation (1) to estimate the empirical factor


            N


            t


          of
        
        
          Kulhaway and Mayne (1990), as shown in Equation 2.


            t


            vo


            t


            p


            N


            q


          ´
        
        
          with
        
        
          ´


            n


            t


            b


            N


          (2)
        
        
          The use of equation 2 with


            b


          =34MPa/m for the SFL clay layer
        
        
          of Embraport site (see Figure 2-a) resulted in


            N


            t


          =3.9 and the
        
        
          constant


            C


            2


          of equation 1 varying from 80 to 115kPa, revealing
        
        
          the great heterogeneity of the soil (see also Teixeira 1960 on
        
        
          this feature). The high values of


          ’
        
        
          p
        
        
          for the Embraport site are
        
        
          associated with


            OCR


          >2 at mid height of the layer, as shown in
        
        
          Table 2. Furthermore, Figure 2-b shows also data of odometer
        
        
          tests (dashed line is the average) carried out by Andrade (2009)
        
        
          that agree with the


            ´


            p


          of the nearest CPTU.
        
        
          The shear strength of the SFL clays follows the equation


            s


            u


            =c


            o


            +c


            1


            .z


          , with


            c


            1


            =0.4


          ´.For Embraport site the


            c


            o


          values are
        
        
          higher (Table 2), as those found in Santos City (Teixeira 1994).
        
        
          Figure 5 shows that: a) the


            c


            h


          for the overconsolidated range
        
        
          (o.c.) varies from 4.7x10
        
        
          -3
        
        
          to 1.5x10
        
        
          -1
        
        
          cm
        
        
          2
        
        
          /s (mean value of
        
        
          2.1x10
        
        
          -2
        
        
          cm
        
        
          2
        
        
          /s) for the soft clay (SFL) layer (8 to 17m depth);
        
        
          and b) the upper sand and the lower clay/sand layers are highly
        
        
          permeable. In cases like this there is no need to use drains, as
        
        
          shown by Pilot (1991) besides local practice (Massad, 2009-a).