 
          2959
        
        
          Technical Committee 214 /


            Comité technique 214


          However, the perimeter of the circular pile is 1.338 m, which is
        
        
          smaller than that of the XCC pile of 1.759 m. Thus, with the
        
        
          same cross section area, the pile-soil interface contact area of
        
        
          the XCC pile is 31.5 % more than that of the circular pile.


            4.2 Analysis of Test Results and Discussions


            100


            80


            60


            40


            20


            0


            0


            20 40 60 80 100 120 140


          (a)
        
        
          XCC pile
        
        
          Circular pile
        
        
          Pile head compressive load,


            Q


          (kN)
        
        
          Displacement of pile head,


            s


          (mm)


            -100


            -80


            -60


            -40


            -20


            0


            -20 -30 -40 -50 -60 -70 -80 -90


          (b)
        
        
          XCC pile
        
        
          Circular pile
        
        
          Pile head uplift load,


            Q


          (kN)
        
        
          Displacement of pile head,


            s


          (mm)


            50


            40


            30


            20


            10


            0


            0


            10


            20


            30


            40


            50


            60


          (c)
        
        
          XCC pile
        
        
          Circular pile
        
        
          Pile head lateral load,


            H


          0
        
        
          (kN)
        
        
          Lateral displacement of pile head,


            y


          0
        
        
          (mm)
        
        
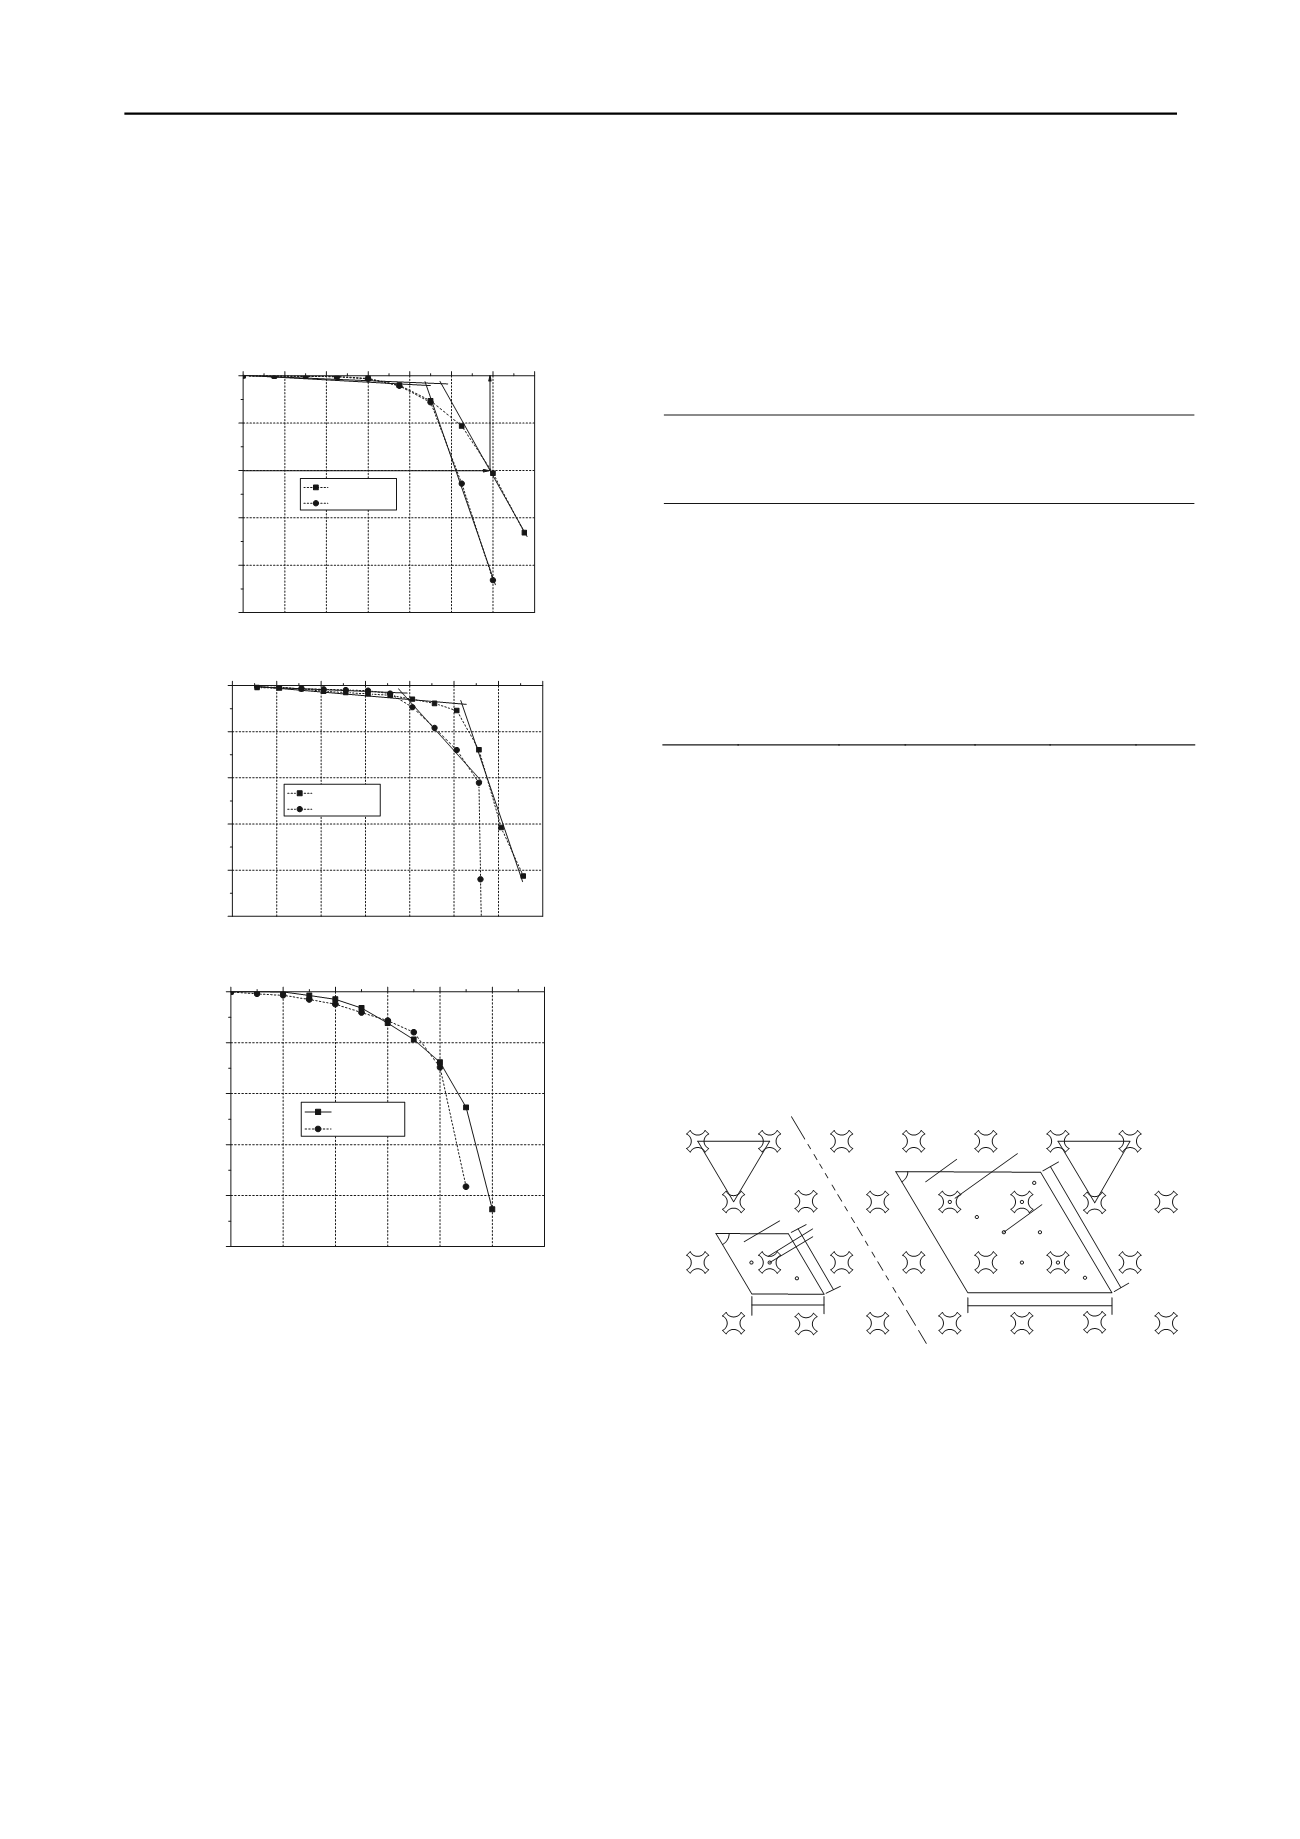
          Figure 2. The curves of load versus displacement: (a) compressive load-
        
        
          displacement; (b) uplift load-displacement; (c) lateral load-displacement.
        
        
          Fig. 2(a) shows load-displacement curves of the XCC pile and
        
        
          the circular section pile at the pile head. The ultimate
        
        
          compressive load-carrying capacity of the circular pile and XCC
        
        
          pile is equal to 90 kN, and 111 kN, respectively. The ultimate
        
        
          compressive capacity was improved nearly 24.0 % by changing
        
        
          the pile cross section from common circular section to X-
        
        
          section when the same amount of concrete volume was used.
        
        
          Fig. 2(b) shows the load-displacement curves under uplift load
        
        
          for the two different pile sections. The uplift capacity of XCC
        
        
          pile and circular pile was found to be -70.6 kN and -56.1 kN,
        
        
          respectively. The ultimate uplift capacity was improved nearly
        
        
          25.8 % by changing the pile cross section from a circular
        
        
          section to an X-section for the same amount of concrete volume
        
        
          used. The test result of the lateral load versus lateral deflection
        
        
          at pile head is plotted in Fig. 2(c) for two different pile sections.
        
        
          The lateral


            H


          0
        
        
          -


            y


          0
        
        
          curve of XCC pile is similar with that of
        
        
          circular pile. For the same lateral capacity, the amount of
        
        
          concrete volume used in a XCC pile is about 6.9 % less than in
        
        
          a circular pile.
        
        
          5 FIELD TEST CASE STUDY


            5.1 Summary of Field Test Conditions


          The test site locates at north bridge of Nanjing city, where the
        
        
          landform is Yangtze River floodplain. By geological
        
        
          exploration, and laboratory soil test, the physical and
        
        
          mechanical parameters and distribution of soil layers are shown
        
        
          in Table 3.
        
        
          Table 3. The soil layers and soil parameters in field test site
        
        
          Soil
        
        
          symbol
        
        
          Name
        
        
          Depth


            h


          (m)
        
        
          Water
        
        
          content


            w


          (%)
        
        
          Unit
        
        
          weight


            γ


          (kN/m
        
        
          3
        
        
          )
        
        
          Modulus


            E


          s
        
        
          (MPa)
        
        
          Void
        
        
          ratio


            e


          �
        
        
          Filled
        
        
          back soil
        
        
          0.20
        
        
          �
        
        
          2
        
        
          Mucky
        
        
          silty clay
        
        
          1.30
        
        
          38.60
        
        
          17.60
        
        
          3.50
        
        
          1.11
        
        
          �
        
        
          2A
        
        
          Silty sand
        
        
          1.00
        
        
          25.30
        
        
          19.20
        
        
          10.77
        
        
          0.70
        
        
          �
        
        
          2
        
        
          Mucky
        
        
          silty clay
        
        
          1.50
        
        
          38.60
        
        
          17.60
        
        
          3.50
        
        
          1.11
        
        
          �
        
        
          2B
        
        
          Silty sand
        
        
          1.80
        
        
          26.10
        
        
          19.30
        
        
          8.00
        
        
          0.71
        
        
          �
        
        
          2
        
        
          Mucky
        
        
          silty clay
        
        
          2.30
        
        
          38.60
        
        
          17.60
        
        
          3.50
        
        
          1.11
        
        
          �
        
        
          3
        
        
          Fine sand
        
        
          9.40
        
        
          26.30
        
        
          18.90
        
        
          11.83
        
        
          0.76
        
        
          The pile layout in Fig. 3 shows that the piles distribute as
        
        
          equilateral triangles, and the distances between two adjacent
        
        
          piles for single pile test and 2×2 pile groups test equal 1.85 m,
        
        
          and 1.80 m, respectively. In static loading tests of 2×2 pile
        
        
          group composite foundation, the loading plates are rhombic
        
        
          with side length of 3.6 m, which covers four piles. A layer of
        
        
          gravel cushion with the thickness of 30 cm is paved between
        
        
          pile top and loading plate. During the load tests, the total load
        
        
          applied to the loading plate was measured by a load cell placed
        
        
          on the loading plate, the axial force of pile shaft along pile
        
        
          depth was measured by reinforcement stress meters, the soil
        
        
          pressures and pile head pressures were measured by earth
        
        
          pressure cells, and settlement of the pile head was recorded by
        
        
          two LVDTs installed symmetrically at the loading plate. Data
        
        
          from the load cells and LVDTs during the load test were
        
        
          captured by a data acquisition system.
        
        
          1850
        
        
          1850
        
        
          1800
        
        
          1800
        
        
          60
        
        
          o
        
        
          60
        
        
          o


            Unit: mm


          3600
        
        
          1850
        
        
          1850
        
        
          3600


            1


            2


            3


            1


            3


            2


            1: XCC pile


            2: Loading plate


            3: Soil pressure cell


          Figure 3. The instrument arrangements of XCC pile composite
        
        
          foundation.


            5.2 Analysis of Test Results and Discussions


          Fig. 4 shows the changes of axial forces result in the variations
        
        
          of side friction. When the load is relatively large, the side
        
        
          friction from the depth of -1 m to -2 m is negative, which is the
        
        
          typical characteristic of composite foundation. The load applied
        
        
          on loading plate causes the non-uniform settlement between the
        
        
          soil and piles. When the load is not very large, the differential
        
        
          settlement is in apparent, so the negative friction is extremely
        
        
          small. As the increase of the load step, the load shared by the
        
        
          piles also increases, and then the pile top tends to penetrate into
        
        
          the cushion, at the same time the soil subsidence occurs under