2963
Technical Committee 214 /
Comité technique 214
0
5
10
15
20
25
1,0E-03
1,0E-02
1,0E-01
1,0E+00
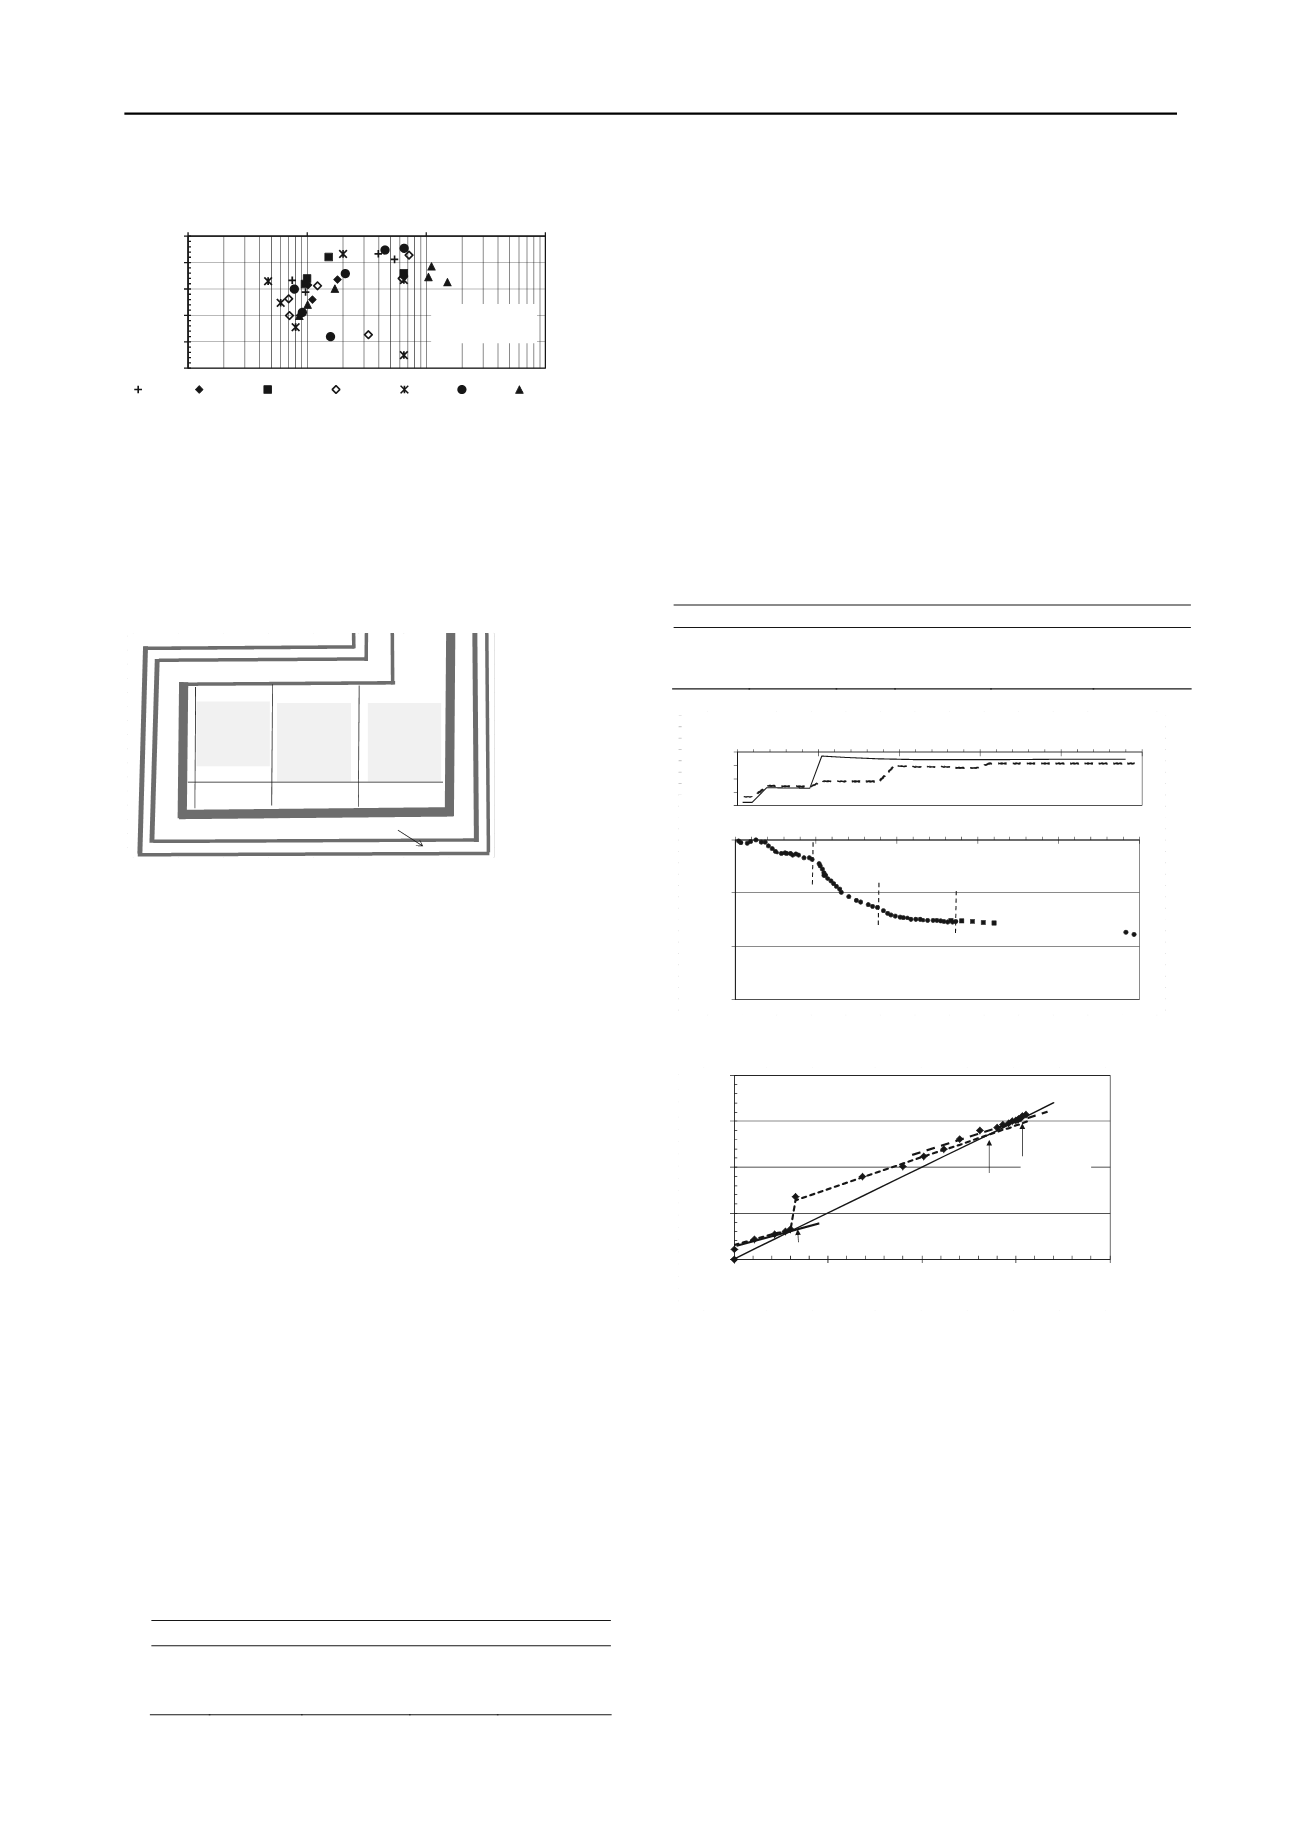
Depth (m)
Horizontal Coefficient of Consolidation (o.c.) (cm
2
/s)
EMBRAPORT
AREA 3
PZM 16 PZM 101 PZM 103 PZM 110 PZ 116 PZ 115 PZM 120
Figure 5: Data from dissipation tests of 7 CPTUs at Area 3.
3 PILOT EMBANKMENT 1
An experimental earth fill – the Pilot Embankment 1 - was built
in the Area 3 before it was reclaimed underwater. It was divided
in three parts (see Figure 6), Segments 1 and 2 with square
meshes of geodrains 25m length, spaced 1,2m and 2.4m,
respectively, and Segment 3, without vertical drains.
SEGMENT3
no
geodrains
SEGMENT2
geodrain
mesh:
2.4x2.4m)
SEGMENT1
geodrain
mesh:
1.2x1.2m)
Berm 2
Berm 1
Acess
50 m
50 m
50 m
Figure 6: Relative positions of the Segments. Pilot Embankment 1
Detailed information about the construction and the
instrumentation is found in Rémy et al (2010). It is worth
mentioning that the rate of loading was distinct among the
segments. And it was also distinct in Segment 3, comprising
two sides, North and South, with different heights. Figure 2
shows the subsoil in the site.
Many difficulties arose in the interpretation of the data of the
Embankment Pilot 1. They refer to the following drawbacks:
a) the Segments 1, 2 and 3 were too close and the earth fill
loads were applied at different rates; for Segments 1 and 2,
the 4 loading stages were applied during 354 and 452 days,
respectively; for Segment 1, the 2 stages required 142 days;
b) the installation of the geodrains involved the use of a
temporary casing 2 inches inside diameter and flushing
water to pass through the upper sand layers (see Figure 2)
besides the fact that the soil resistance was high; and
c) there occurred two problems with the measuring probe of
the magnet extensometers. The first one in Nov., 13
th
, 2008
(day 400 in Figure 7) when the measuring probe was
changed; ant the second one between Feb.,19
th
, 2009 (day
485) and Sept., 16
th
, 2009 (day 694), that is, 209 days with
no measurements, due to damage in the probe device.
Figure 7 shows the measured settlements of the Soft Clay (SFL)
layer, between 8 and 17m (see Figure 2) of Segment 3. The plot
reveals: a) the interference between the Segments 2 and 3, due
to their proximity and the differences in the rate of loading, as
mentioned above; and b) the 3 stages of loading that occurred,
making it possible to apply Asaoka’s Method, as shown in
Figure 8. Table 3 presents the results of this analysis.
Table 3: Results of the Application of Asaoka’s Method
Stage c
v
(cm
2
/s)
f
EOP(cm)
f
/H (%)
'
vf
/
'
vo
(*)
1 3.10
-2
3.5
0.37
1.29
2 2.10
-2
13.5
1.42
1.88
3 2.10
-2
15.3
-
-
Note: (*) in the center of the SFL Clay layer
With the preconsolidation pressures indicated in Figure 2-b it
follows an average
OCR
=2.2 for the center of the Soft Clay
(SFL) layer. The conclusion is that the SFL Soft Clay of
Embraport site behaved as an overconsolidated clay, of Class 2
of Table 2. Moreover, note that the
c
h
~c
v
given by Figure 5
agrees with the values of Table 3 and with local experience.
Due to the second difficulty and to the highly permeable layers,
the geodrains of Segments 1 and 2 were disregarded, a position
that differs from that of Rémy et al (2010) being a different
view. Table 4 endorses this position: the indicated plates were
installedat the base of the earth fills and the values of
c
v
are
equivalent in the sense that they refer to all layers. It can be seen
that the drain installation greatly affected the
EOP
settlements
but lesser the time of its occurrence. These conclusions are in
consonance with the research by Saye (2001) with the Florence
Lake Clay, in Omaha, Nebraska (USA).
Table 4: Influence of soil disturbance due to drain installation
Segment Geodrains Plate Max. Level
c
v
/H
d
2
f
EOP(cm)
1
2.4x2.4m PR 02 7.27m
4.2*10
-3
/day 194
2
1.2x1.2m PR 08 6.95m
3.5*10
-3
/day ~137
3
without
PR 11 7.70m
7.0*10
-3
/day 89
-0,30
-0,20
-0,10
0,00
0
150
300
450
600
750
Settlements (m)
Time (days)
SEGMENT 3 - SOFT CLAY (SFL)
0
2
4
6
8
0
150
300
450
600
750
Fill Elevation
(m)
Time (days)
Segment 3
Segment 2
Stage 1
Stage 2
Stage 3
PILOT EMBANKMENT 1
Figure 7: Compression of the Soft Clay (SFL) layer. Segment 3
_eop (1/s)
47
1,8E-10
41
1,5E-10
39
1,3E-10
35
1,1E-10
31
9,3E-11
0
5
10
15
20
0
5
10
15
20
(n+1)
- (cm)
n
(cm)
c
v
=2*10
-2
cm
2
/s
c
v
=3*10
-2
~13.5cm
3.5cm
~15.3cm
c
v
=2*10
-2
cm
2
/s
Stage 1
Stage 2
Stage 3
SEGMENT 3 - SOFT CLAY (SFL)
Figure 8: Asaoka’s Method - Pilot Embankment 1
4 PILOT EMBANKMENTS 2 AND 3
A second experimental fill (Pilot Embankment 2) was built in
Area 3, with a maximum height of 5.2m. Figure 9 displays de
subsoil profile and gives information about the initial and final
stresses, the preconsolidation pressures and the
OCR
.
The values of the end of primary settlement (
f
) and c
v
/
H
2
d
were determined as illustrated in Figure 10 for one of the 4
plates installed at the earth fill base for the two stages shown in
Figure 11-a. Note again that
c
v
is equivalent in the sense that it
refers to all layers and that, after roughly 5 month, at least 95%
of the primary settlement was reached.
The Figures 11-a and 11-b show also the very good fittings of
the theoretical and measured values of settlements and the
product
v.t
(velocity*time) along the primary consolidation
time. For the secondary range,
v.t
reached a constant value,
allowing the estimation of
C
=0,85%, consistent with the
values obtained for the Santos’ Buildings (for more details,


