2903
Technical Committee 212 /
Comité technique 212
3 CASE STUDY 2
This is a recent case study associated with the Barangaroo South
Stage 1A Development located on the western fringe of the
Sydney CBD, on the eastern shoreline of Darling Harbour.
The site is situated over reclaimed land in an eroded and
infilled paleovalley, with rock ranging in depth from 0m to 30m
as shown in Figure 3. As such, most of the weathered rock has
been removed during the erosional process, and replaced with
overlying Holocene alluvial sand, silt, clay, and manmade fill.
Figure 3. Stratigraphic profile at the site of Case Study 2
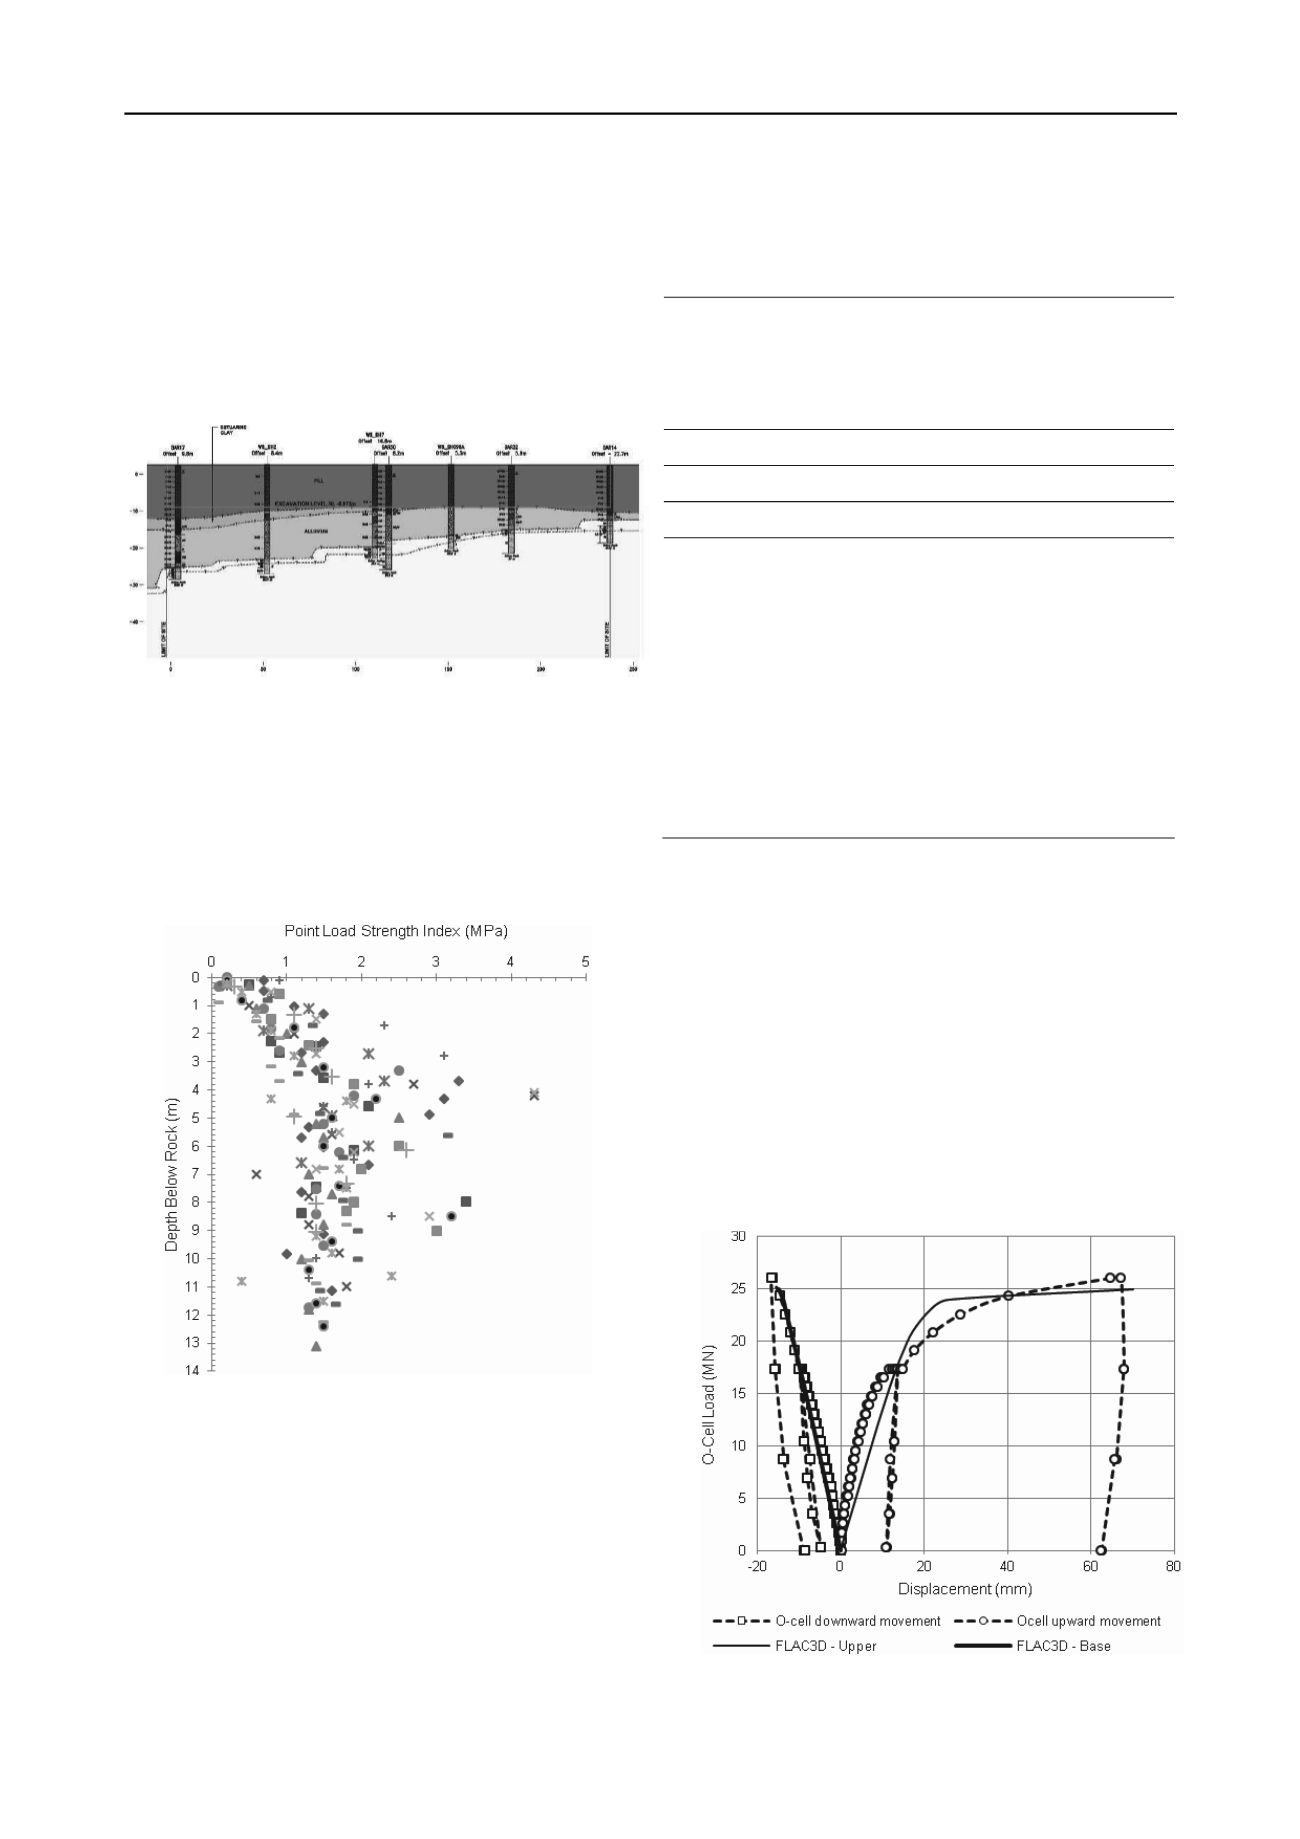
The rocks at the site comprise Hawkesbury Sandstone, with
average Point Load Strength Index ranging from 0.05MPa to
1.5MPa between 1m to 3m below rock surface, thereafter
having an average Point Load Strength of about 1.5MPa as
shown in Figure 4. These Point Load Strength index tests
suggested the unconfined compressive strength of the rock to be
on average about 30MPa below 3m depth, but layers having
strengths as high as 60MPa to 80MPa are likely to exist.
Figure 4. Point Load Strength Test Results (Case Study 2)
The sandstone rock at the site was classified in accordance
with Pells et al (1998), and preliminary design parameters for
pile design were assigned as summarized in Table 3. The
project required nearly 1000 piles with diameters ranging from
1m to 2.4m to support 3 towers of up to 34 storeys in height and
a number of low rise buildings over a 4ha site. The design
serviceability pile loads ranged from 7MN to 14MN for 1m
diameter piles, to 72MN to 81MN for the 2.4m diameter piles.
The structural engineer for the project was particularly
concerned about long-term differential settlement effects on the
tower structure, and therefore specified tight pile settlement
criteria. A pile toe settlement limit of 0.3% of the pile diameter
was stipulated at the pile toe. This was an unusual specification
but it was adopted by the structural engineer so that equivalent
structural “springs” could be adopted for the piles in his
structural model of the superstructure, to include modeling of
the piles due to the varying pile lengths on the project.
Table 3. Design Values Adopted for Design (Case Study 2)
Sandstone
Rock Class
Elastic
Modulus*
(GPa)
Poisson’s
Ratio
Ultimate
End
Bearing
Pressure
(MPa)
Ultimate
Shaft
Friction
(MPa)
IV
0.5
0.3
10
0.5
III
1.0
0.3
20
0.8
II or better
2.0
0.2
80
2
*
These represented the initial tangent modulus values.
A non-linear analysis using the following equation was adopted to
describe the secant modulus:
E
sec
= E
t
[1 – R
f
(p/p
f
)]
where:
E
t
= initial tangent elastic modulus (values given in the table)
R
f
= hyperbolic curve-fitting constant (R
fs
= 0.25 adopted for shaft
and R
fb
= 0.7 adopted for base)
p = mobilized pile-soil stress
p
f
= limiting value of pile-soil stress (values of fb and fs given in
table)
Because of concerns that dynamic testing would not be able
to provide sufficient test load and would not capture the
potential creep effect of the rock at high loads, pile load testing
was conducted on two 750mm diameter prototype piles fitted
with Osterberg Cells (O-Cell). Load-settlement prediction, pile
load testing, and back-analyses of the pile load testing results
for the project has been described in Wong and Oliveira (2012).
In brief, the two test piles had rock socket lengths of 7.85m
(SC-01) and 6.38m (SC-02); both founded with the pile toe
socketed more than 3.5m in Class II Sandstone. The O-Cell
was located at the toe of the test piles and the maximum O-Cell
load reached was 22.6MN for SC-01 and 26MN for SC-02.
The test results for SC-02, together with results of back-
analyses using the embedded pile element method in the
commercial finite element analysis program FLAC (3D), are
presented in Figure 5.
Figure 5. O-Cell Test and Back-analysis Results (Test Pile SC-02)
The key findings of the O-Cell testing are summarized below:


