 
          2894
        
        
          Proceedings of the 18
        
        
          th
        
        
          International Conference on Soil Mechanics and Geotechnical Engineering, Paris 2013
        
        
          different experimental programs were performed to this aim.
        
        
          Initially, centrifuge model experiments were carried out on
        
        
          scaled models of helical anchors with different dimensions in
        
        
          sand, at the “French Institute of Science and Technology for
        
        
          Transport, Development and Networks” (IFSTTAR) in Nantes,
        
        
          France, to investigate the variability of the rate of capacity gain
        
        
          due to the addition of one more helix to a helical anchor.
        
        
          Considering that the use of helical anchors as tower
        
        
          foundation has being increased in Brazil, and tropical soils
        
        
          covers a significant part of the Brazilian territory, the second
        
        
          experimental program of the present investigation was carried
        
        
          out at a site of tropical soil, to evaluate the influence of the
        
        
          helical anchor configuration on the installation torque and on its
        
        
          uplift capacity.
        
        
          2 EXPERIMENTS


            2.1 Centrifuge testing modeling


          A centrifuge model program was performed at the IFSTTAR, in
        
        
          France, to verify the influence of the diameter and number of
        
        
          helices on the multi-helix anchor uplift capacity in sand. The
        
        
          purpose of centrifuge modeling is to reproduce a full-scale
        
        
          response, with the possibility of comparisons between helical
        
        
          anchors with different dimensions, as the model anchors were
        
        
          installed in a uniform sand mass.
        
        
          Nine small-scale anchor models (Figure 2; Table 1) were
        
        
          tested in two different samples of dry NE34 Fontainebleau silica
        
        
          sand (Table 2), with relative densities of 56% (container 1) and
        
        
          85% (comtainer 2), respectively. The samples were prepared by
        
        
          the air-pluviation technique in two containers with dimensions
        
        
          of 1200 mm × 800 mm in plan area and a height of 340 mm.
        
        
          Figure 2. Photography of the model anchors.
        
        
          For this investigation, tension load tests were performed on
        
        
          reduced-scale model piles, without helical plates (P10 to P12),
        
        
          to separate the shaft resistance, Q
        
        
          s
        
        
          , from the total helical anchor
        
        
          uplift capacity, Q
        
        
          u
        
        
          (see Figure 3 and 4). The cylindrical model
        
        
          anchors (multi-helix with same plate diameter), shown in Figure
        
        
          2, were fabricated with the spacing between any two helices of
        
        
          three times the helix diameter.
        
        
          Q
        
        
          u
        
        
          Q
        
        
          s
        
        
          Q
        
        
          h3
        
        
          Q
        
        
          h2
        
        
          Q
        
        
          h1
        
        
          sand
        
        
          Figure 3. Resisting forces to upward movement of a multi-helix anchor
        
        
          in sand according to the “ individual bearing” failure mechanism.
        
        
          Table 1. Dimensions of model anchors (M) and prototype anchors (P).
        
        
          Pile
        
        
          Nº
        
        
          of helix
        
        
          Shaft
        
        
          diameter
        
        
          d
        
        
          M
        
        
          (d
        
        
          P
        
        
          ) mm)
        
        
          Helix
        
        
          diameter
        
        
          D
        
        
          M
        
        
          (D
        
        
          P
        
        
          ) (mm)
        
        
          Prototype
        
        
          tip depth
        
        
          (m)
        
        
          P1
        
        
          1
        
        
          3.0(64.3)
        
        
          10(214)
        
        
          3.1
        
        
          P2
        
        
          2
        
        
          3.0(64.3)
        
        
          10(214)
        
        
          3.1
        
        
          P3
        
        
          3
        
        
          3.0(64.3)
        
        
          10(214)
        
        
          3.1
        
        
          P4
        
        
          1
        
        
          4.5(97.7)
        
        
          15(326)
        
        
          4.6
        
        
          P5
        
        
          2
        
        
          4.5(97.7)
        
        
          15(326)
        
        
          4.6
        
        
          P6
        
        
          3
        
        
          4.5(97.7)
        
        
          15(326)
        
        
          4.6
        
        
          P7
        
        
          1
        
        
          6.0(132)
        
        
          20(440)
        
        
          6.2
        
        
          P8
        
        
          2
        
        
          6.0(132)
        
        
          20(440)
        
        
          6.2
        
        
          P9
        
        
          3
        
        
          6.0(132)
        
        
          20(440)
        
        
          6.2
        
        
          P10
        
        
          -
        
        
          3.0(64.3)
        
        
          10(214)
        
        
          3.1
        
        
          P11
        
        
          -
        
        
          4.5(97.7)
        
        
          15(326)
        
        
          4.6
        
        
          P12
        
        
          -
        
        
          6.0(132)
        
        
          20(440)
        
        
          6.2
        
        
          Table 2. Sand properties.
        
        
          Property
        
        
          Value
        
        
          Unit weight of soil particles (kN/m
        
        
          3
        
        
          )
        
        
          25.90
        
        
          Maximum dry density (kN/m
        
        
          3
        
        
          )
        
        
          16.68
        
        
          Minimum dry density (kN/m
        
        
          3
        
        
          )
        
        
          14.13
        
        
          Maximum void radio
        
        
          0.834
        
        
          Minimum void radio
        
        
          0.550
        
        
          Maximum porosity
        
        
          0.455
        
        
          Minimum porosity
        
        
          0.355
        
        
          Container 1
        
        
          Unit weight (kN/m
        
        
          3
        
        
          )
        
        
          15.46
        
        
          Density index (%)
        
        
          56
        
        
          Friction angle (º )
        
        
          31
        
        
          Container 2
        
        
          Unit weight (kN/m
        
        
          3
        
        
          )
        
        
          16.30
        
        
          Density index (%)
        
        
          85
        
        
          Friction angle (º )
        
        
          41
        
        
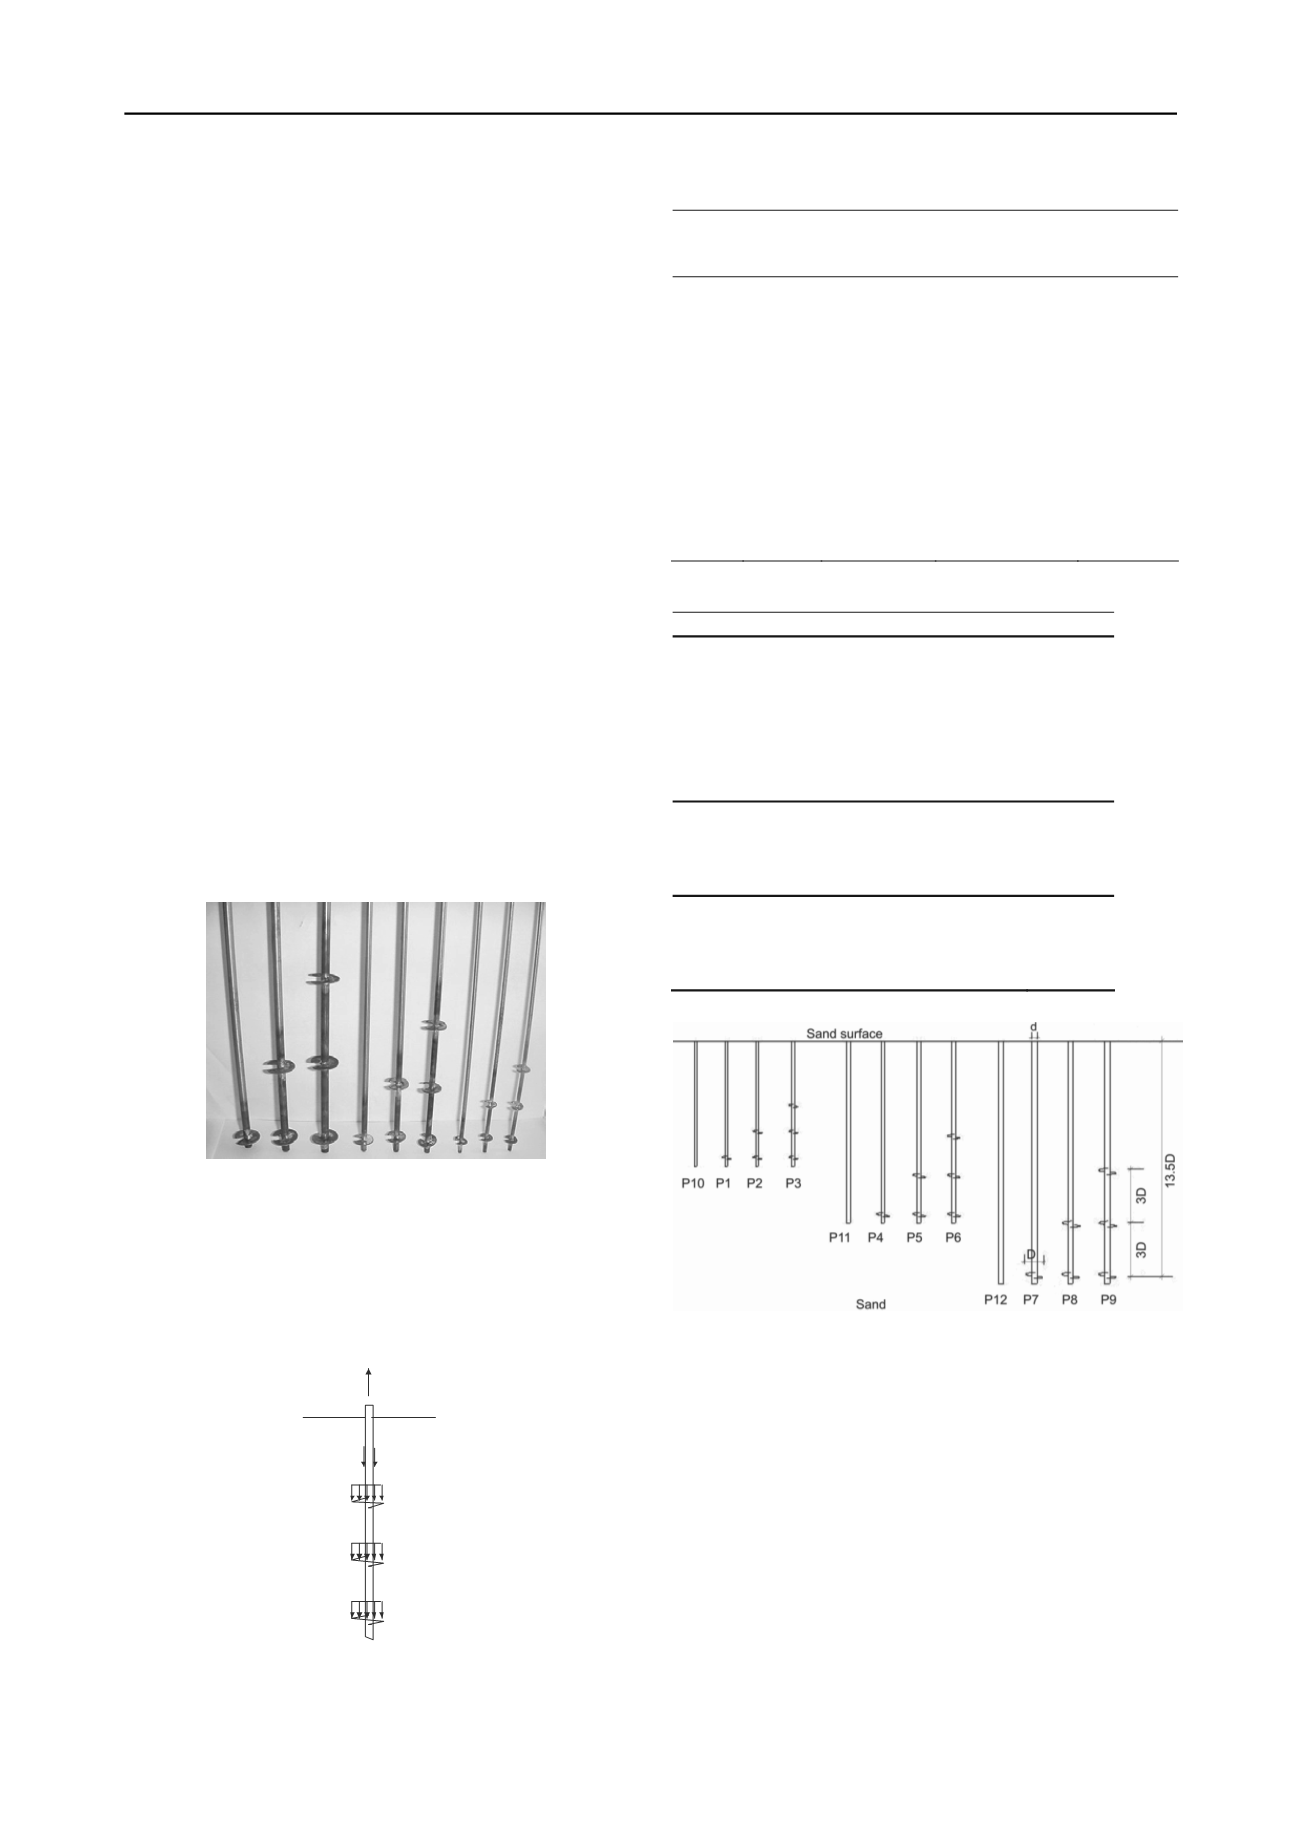
          Figure 4. Model piles installed in the sand sample.
        
        
          A total of 18 tensile loading tests were carried out on the
        
        
          model anchors, nine in the sand container 1, and nine in the
        
        
          container 2. The model anchors were installed at three different
        
        
          depths as illustrated in Figure 4. Further details of this
        
        
          experimental investigation are described in Tsuha et al. (2007).


            2.1.1 Results of centrifuge tests


          Figure 3 shows examples of load–displacement curves of tensile
        
        
          tests performed on the model anchors of 214mm helix
        
        
          (prototype) diameter, installed in the container 2 (denser sand).
        
        
          The curves of the other loading tests carried out for this
        
        
          investigation are presented in Tsuha et al. (2012).
        
        
          From the results of this investigation, the fractions of the
        
        
          total helix bearing capacity (Q
        
        
          h
        
        
          ), related to each helical plate of
        
        
          the double-helix anchors (F
        
        
          Qhi
        
        
          = Q
        
        
          hi
        
        
          /Q
        
        
          h
        
        
          , where Q
        
        
          hi
        
        
          is the uplift
        
        
          helix bearing capacity of helix i), were calculated. The portion
        
        
          of helix bearing capacity related to the second helix (Qh
        
        
          2
        
        
          ) of the
        
        
          double-helix anchors was determined by the difference between