2886
Proceedings of the 18
th
International Conference on Soil Mechanics and Geotechnical Engineering, Paris 2013
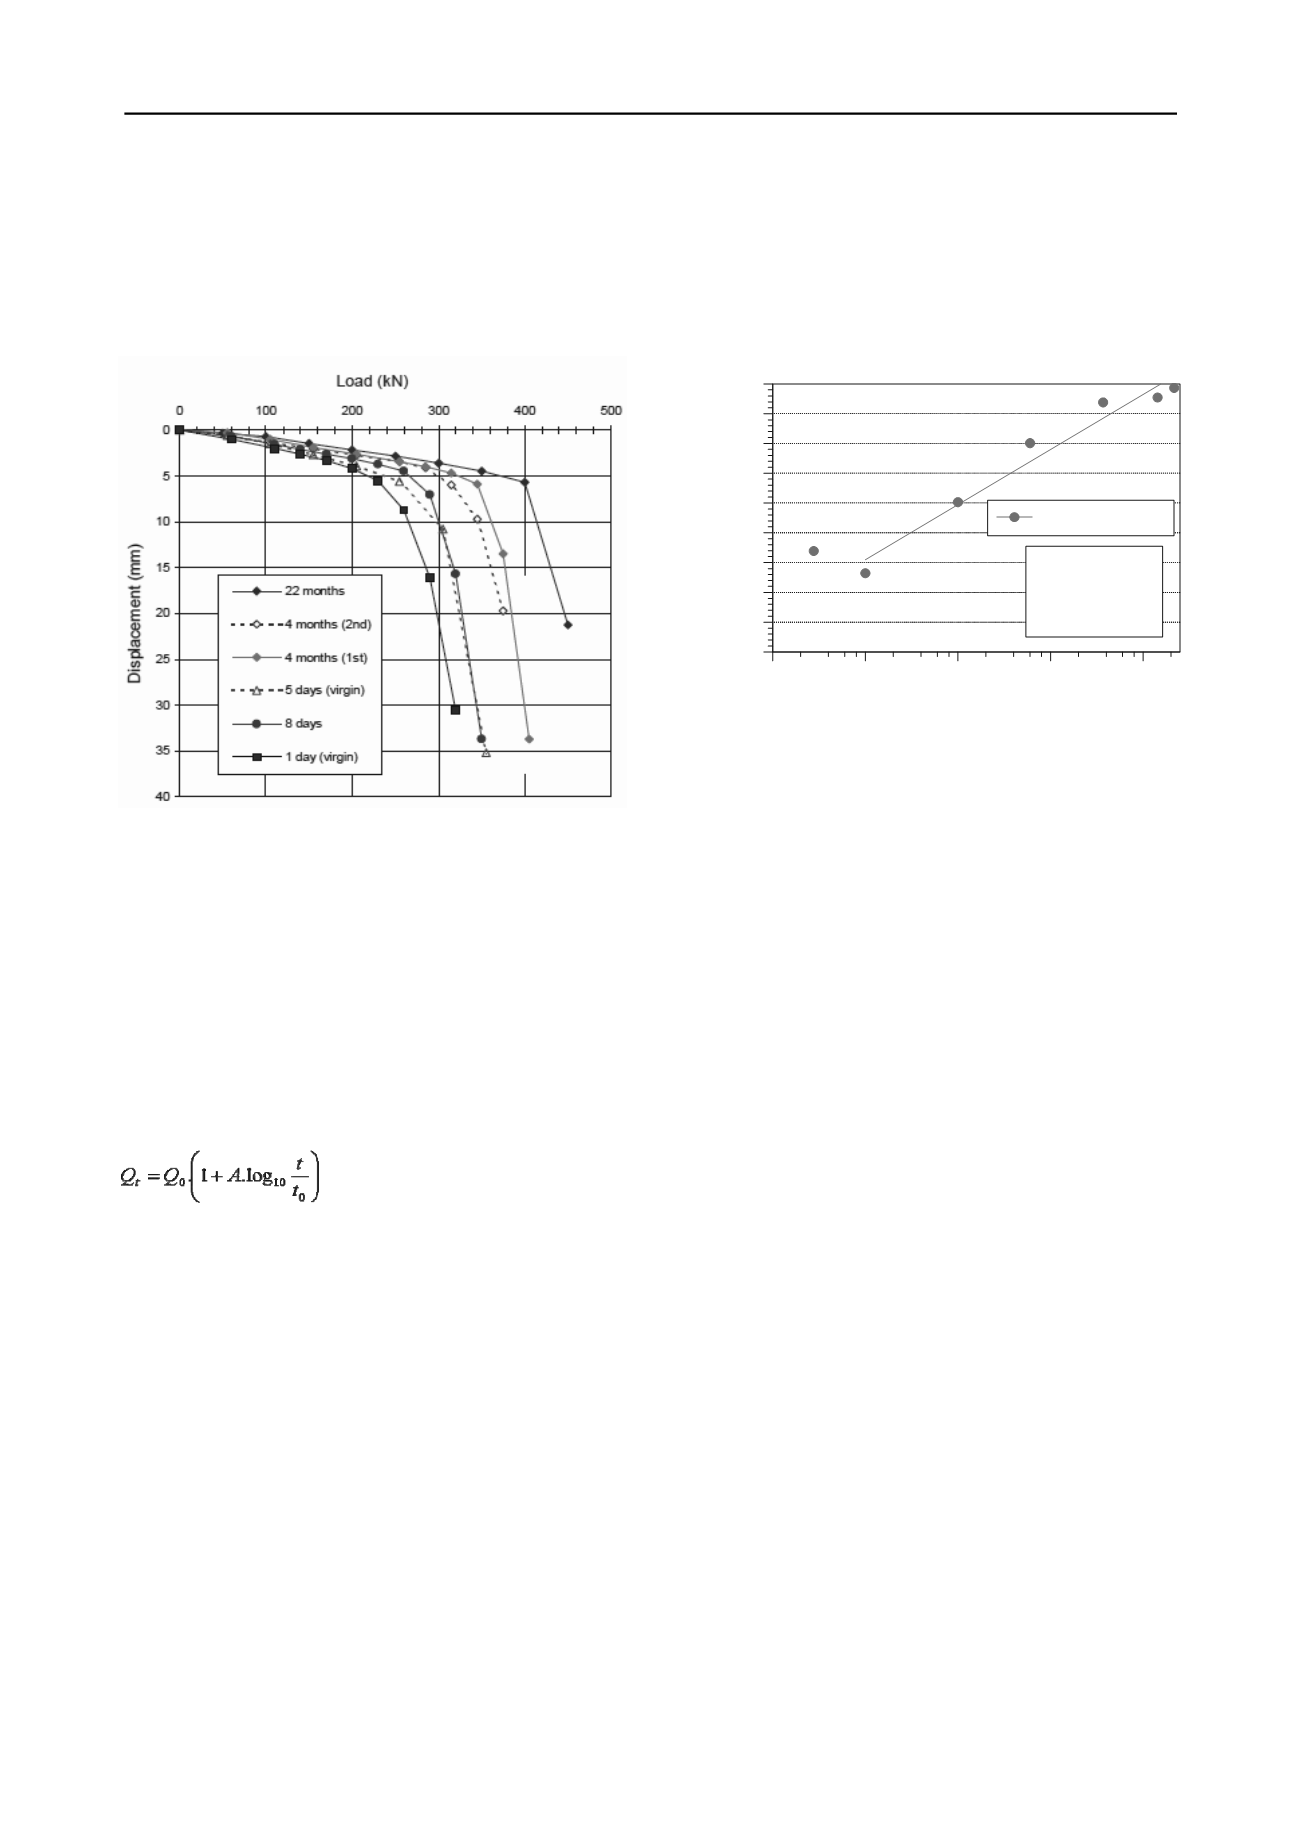
the shaft. Static load tests were conducted 1, 5, 8, 141 and 667
days after the installation of the pile. Figure 2 shows the load-
displacement curves for the load tests. This shows that the total
capacity of the pile increases substantially over time. The
increase in the pile-base capacity is at maximum approximately
10%. The increase in capacity is therefore mainly caused by an
increase in the shaft capacity.
Figure 2. Head displacement, static tests, Axelsson (2000)
This is confirmed by the horizontal effective stress on the
pile shaft. A distinction is made between the horizontal stress on
the pile in loaded and unloaded conditions. The difference
between the contact pressure in loaded and unloaded conditions
is caused by dilatant behaviour. The increase over time of the
horizontal stress during loading is primarily a result of
increasing dilatant behaviour, which indicates a change in
particle structure where the pile and the soil meet (Axelsson,
2000).
The increase in capacity over time is expressed by a range of
authors as an increase with the logarithm of time in line with the
equation below (Skov and Denver, 1988):
(1)
Where:
Q
t
is the pile capacity at time t
Q is the pile capacity at t
0
0
A is a factor – dependent of the type of soil
t
0
is the time for Q
0
The values for A used in the literature for clay and sand
respectively are 0.6 and 0.2. This means that capacity increases
by 60% per decade in clay and by 20% in sand. The lower limit
generally used for piles in sand is 15%. However, Axelsson's
study stated a much higher value of A=37.5% for a driven
concrete pile in silty sand, see Figure 3.
The literature relating to set-up, the usual term for the
phenomenon of increasing capacity over time, shows that the
following factors are important in determining the set-up level
(Axelsson, 2000; Sobolewsky; 1995, Chow & Jardine, 1997;
Joshi et al., 1995; Baxter & Mitchell, 2004):
•
Relative density and stiffness of the soil: set-up increases
with density
•
Particle-size distribution: set-up in silty sand is higher than
in coarser sand
•
Particle strength: set-up is higher in strong sands
•
Particle structure and form: angular particles result in
higher set-up
•
Soil humidity: very high set-up is observed in unsaturated
sand
•
Stress level: at high stress levels, dilatant behaviour is a
more significant factor
•
Installation process determines the stress conditions after
installation and therefore set-up
•
Diameter of pile: higher set-up with smaller diameter
0
200
400
600
800
1,000
1,200
1,400
1,600
1,800
Capacity (kN)
10
-2
10
-1
10
0
10
1
10
2
time (days)
Axelsson B, 2002
Q = 989 kN
0
A = 0.374
t = 1 day
0
Figure 3. Measurements from Axelsson, 2000, fitted with equation (1)
Before the positive effect of time can be included in the
regulations, the most important of these factors will have to be
investigated. Another important question is the extent to which
the increase in capacity persists after varying loads have been
imposed. A study by Jardine et al. (2006) demonstrated that the
repeated testing of piles in sand resulted in lower capacity
measurements than tests on piles that have not been subjected to
loads in the past. Tensile capacity in repeat testing approximates
the trend line of Chow at al. (1997) which corresponds,
according to their findings, with A is approximately 27.5%.
Subsequent research will, then, have to take this into
account, as well as the effects of varying loads.
3 RESIDUAL STRESSES
In loading tests with driven piles, the strain gauges used to
measure the forces in the pile are normally reset to 0 after the
installation of the pile or installed as a string of gauges
cemented into a tube in the pile, also after installation. That
means that any residual stresses present in the pile base (after
pile-driving) are not included in the measurement of the base
capacity in pile load tests. This could explain why the pile-base
capacity in the load tests was low (and lower than the value
resulting from the design rule). However, any increase in the
base capacity resulting from this consideration will be at the
expense of the shaft capacity.
Xu et al. (2008) showed that the residual stress at the pile
base is negligible in the case of piles when penetration is less
than 20D; substantial residual stresses occur only when the
driven depth exceeds 30D in the load-bearing layer. This
phenomenon does not therefore explain the low pile-base
resistance as shown in Figure 1, where the penetration depth of
all the piles is less than 25D.
4 LIMITING – LIMIT VALUES
Another explanation for the lack of problems with the capacity
of driven piles in practice could therefore be that the limit
values prescribed in the Dutch standard (15 MPa for pile-base
resistance and 150 kPa for shaft resistance) are too conservative.
On the basis of a comparison between foreign standards and
research looking at measured pile-base stresses in sand layers
with very high cone resistances, it can be concluded that:


