2902
Proceedings of the 18
th
International Conference on Soil Mechanics and Geotechnical Engineering, Paris 2013
may take a majority of the load and the mobilized shaft
resistance, particularly towards the top of the pile shaft, may
reach close to the “ultimate” values.
It can be seen from Tables 1 and 2 that in conventional
working stress terms, the ratio of ultimate end bearing value to
the serviceability value would give rise to equivalent factors of
safety of about 3 for the poorer quality rock, to 10 or more for
Class I Shale and Sandstone. While it may be “safe” to adopt
the presumptive “serviceability” values based on the notion that
settlement will be less than 1% of the minimum footing size,
there is no assessment on “how much less than 1%”. Also, 1%
of a relatively small diameter pile (say 0.6m dia.) would be very
different to 1% of a 2m square footing (i.e. < 6mm compared to
< 20mm settlement).
The difference between conducting a design based simply on
presumptive “serviceability” values and a more detailed
assessment of load-deformation response of a 1.8m diameter
pile socketed 6m into rock (1m in Class V Sandstone, 2m in
Class IV Sandstone, and 3m in Class III Sandstone) is
illustrated in Figure 1 below. In both cases, the ultimate load
capacity of the pile was assessed using the same values (f
su
of
0.1MPa, 0.5MPa and 0.8MPa in Class V, IV and III Sandstone
respectively, and f
bu
of 20MPa for the Class III Sandstone).
Using these parameters, the ultimate load for this pile was
assessed to be 70MN. However, the load-deformation curves
were in one case assessed using the method described by Poulos
(1979), while in the other case as an extrapolation of a linear
line between zero and the assessed ultimate load, with the line
intersecting an assumed settlement of 1% at the pile load
computed using the presumptive “serviceability” design values
given by Pells et al (1998).
Figure 1. Load-deformation curves for Illustrative Example
Figure 1 shows that for the case corresponding to a
presumptive settlement of 1%, the computed “serviceability”
capacity would be limited to 18MN which corresponds to a
relatively high factor of safety of 3.9. However, based on the
more detailed load-deformation assessment, the maximum load
to cause the same settlement of 18mm could be as high as
43MN. It should be pointed out that Pells et al (1998)
acknowledges that the “elastic” design method is conservative,
and supports that design be based on non-linear sidewall slip
methods. It is therefore not surprising that the use of more
sophisticated, non-linear load-deformation assessment methods
would result in more economic foundation designs than
adopting presumptive “serviceability” design values.
However, the accurate prediction of pile settlement relies
heavily on knowledge of the foundation material stiffness in
addition to adopting appropriate evaluation methods. Therefore,
the author is of the opinion that using a performance based
design, with pile load testing to validate the load-deformation
response assessed, is more likely to achieve cost-effective
designs, and increase confidence of meeting design objectives.
This performance based design approach is illustrated in two
case studies described below.
wi
th
sh
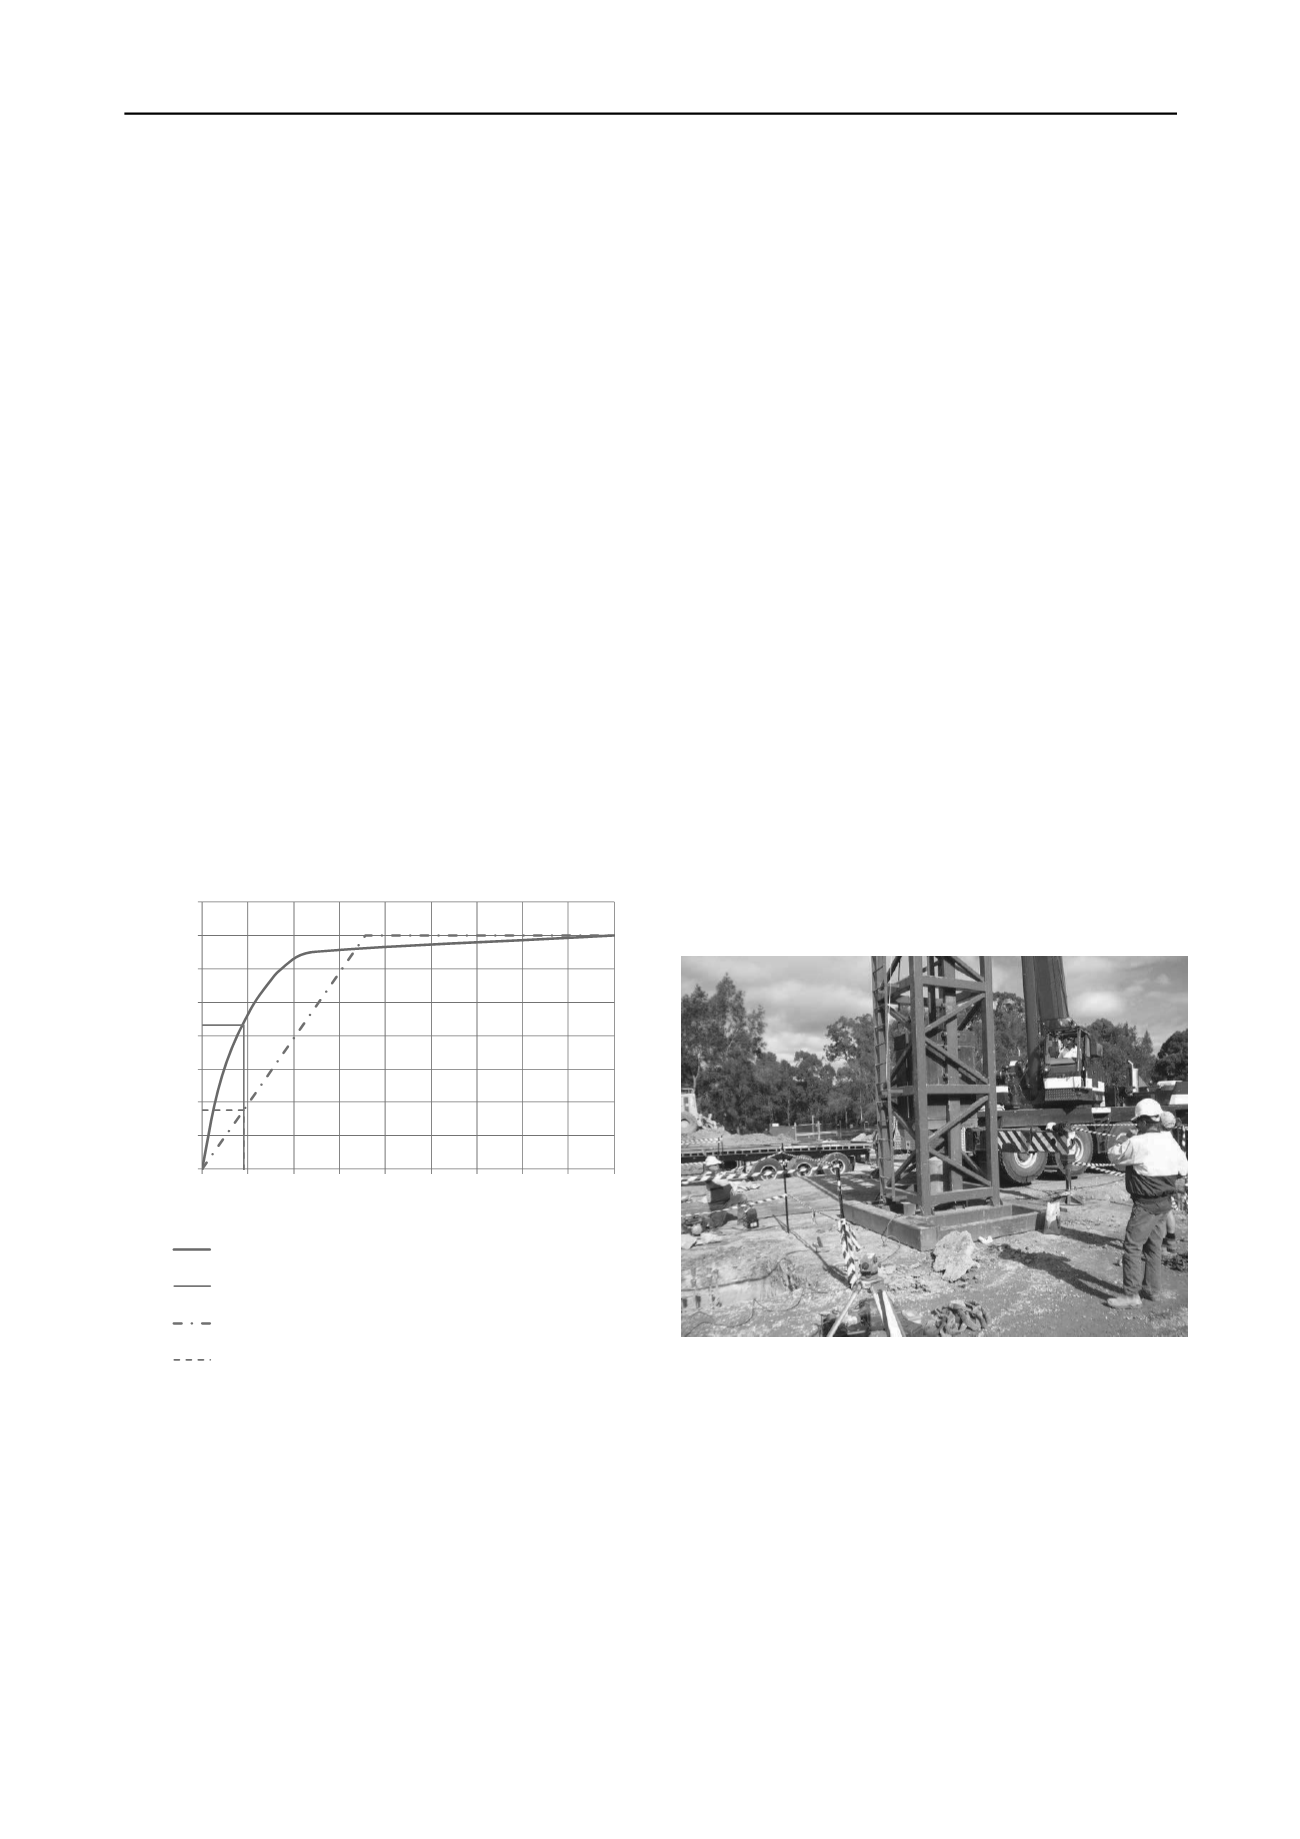
er and a purpose built testing frame as shown in
igure 2. Dynamic pile load test set up in Case Study 1
suggestion
a
and
economic design was clearly demonstrated in this example.
2 CASE STUDY 1
The first case study involves the testing of a 600mm diameter
continuous flight augered pile socketed into weathered Ashfield
Shale in Campbelltown, an outer south-western suburb of
Sydney. The testing was carried out using dynamic technique
th wave matching using the CAPWAP method.
The subsurface stratigraphy at this site comprised 7.3m of
stiff to very stiff compacted clay fill and residual soil, underlain
by a thin veneer (0.3m) of very low to low strength, highly to
moderately weathered shale (Class IV Shale), followed by
medium to high strength shale with Point Load Strength Index
typically between 0.5MPa and 1.5MPa. Based on a typical
correlation factor of 20 for Sydney Shale and Sandstone
(although the range may be between 10 and 30), the
approximate unconfined compressive strength of the medium to
high strength shale is 10MPa to 30MPa, and the rock was
classified as Class II Shale based on Pells et al (1998). The test
pile was socketed 0.3m through the very low to low strength
shale and penetrated only 0.1m into the medium to high streng
ale so that its end bearing pressure can be readily assessed.
The dynamic load testing was carried out using an 11 tonne
drop hamm
0
10
20
30
40
50
60
70
80
0 20 40 60 80 100 120 140 160 180
Load (MN)
Settlement (mm)
Assessed load‐deformation behaviour up to ultimate load
Maximum design load at settlement of 1% pile dia, based on
detailed load deformation assessment
Load‐deformation curve constructed assuming settlement = 1% pile
diameter at pile load corresponding to "serviceability" design values
Design with assumed deformation of 1% using "Serviceability"
Design Values
Figure 2.
F
The CAPWAP analysis results provided an estimated mobilized
total capacity of 12.39MN, with a mobilized shaft resistance of
1.25MN and a mobilized pile toe resistance of 11.14MN. The
mobilized end bearing resistance therefore corresponded to
39.4MPa. The mobilized pile toe settlement during the test
blow was less than 6mm and the inferred static load-
displacement response was relatively stiff with no
th t the ultimate end bearing resistance was reached.
Based on the test results, a “serviceability” design capacity
of 3.4MN (i.e. 12 MPa end bearing pressure) was adopted. If
the piles had been designed using a presumptive “serviceability”
end bearing pressure of 6MPa, the design serviceability load
would have been limited to 1.7MN (i.e. 50% less). The benefit
of the dynamic load test in providing design confidence
may take a majority of the load and the mobilized shaft
resistanc , particularl towards the top of the pile shaft, m y
ach close to he “ultimate” values.
It can be se n fro Tables 1 and 2 that in conventional
working str ss t rms, the r tio of ultimate end bearing value to
the serviceabili y value would give r se o quivalent factors of
safety of about 3 for the poorer qual ty r ck, to 10 or more f r
Class I Shale and Sandstone. While it may be “safe” t adopt
the presumptive “serviceability” values based on the no ion tha
settlement w ll be less than 1% of the minimum footing size,
ther is o assessment on “how muc less than 1%”. Also, 1%
of a relatively small diameter pile (say 0.6m dia.) would be very
diffe n to 1% of a 2m square footing (i.e. < 6mm compared to
< 20mm settlement).
The differ nce between conducting a design based simply on
presumptiv “s rviceability” values and a more detailed
assess ent of load-deformation response of a 1.8m diameter
pil ocke ed 6m into rock (1m in Cla s V Sandstone, 2 in
C as IV Sandsto e, and 3 in Class III Sandstone) is
il u trated in Figure 1 below. In both ca es, the ultimate load
capacity of the pil was assessed using th sam values (f
su
of
0.1MPa, 0.5MPa and 0.8MPa in Class V, IV and III Sandstone
respectively, and f
bu
of 20MPa for the Class II Sandstone).
U ing th se parameters, the ultimate load for this pile was
as essed to be 70MN. However, th load-deformation curve
were in one case assessed using the metho sc ibed by Poulo
(1979), while in th other case as an extrapolation of a linear
line bet een zero and t e ass ssed ultimate lo d, with the line
int rs cting an assumed settlement of 1% t the pile load
computed usi g the pr sump ive “serviceability” d sign values
given by Pells et al (1998).
Figure 1. Load-deformation curves for Illustrative Example
Figure 1 shows that for the case corresponding to a
presumptive settlement of 1%, the omputed “serviceability”
capacity would be limited to 18MN which corr sponds to a
relatively high factor of safety of 3.9. Howeve , based on the
more detailed lo d-deformation assessment, th maximum load
to cause the same settlement of 18 m could be as high s
43MN. It should be poi ed out that Pells t al (1998)
acknowledge that the “elastic” design method is conservative,
nd supports that design be based on non-linear sidewall slip
methods. I is ther fore not surprising that the use of more
sop isticated, non-linear load-defo mation ssessment meth ds
would result in more economic fou d tion d signs than
adopting presumptive “serviceabil ty” design values.
However, the accurate prediction of pile settlement relies
heavily on knowledge of th foundation materia stiffness in
addition to adopting appropriate evaluation ethods. Therefore,
the author is of the o inion that using a p rf rmanc based
design, with pile load testing to validate the load-deform tion
r po se assess d, is more likely to ac ieve cost-effective
desig , and increase confidence of meeting d sign objectives.
This performanc based design approach is illustrated in two
case studies des ribed below.
wi
er and a purpose built testing frame as show in
re 2. Dynamic pile load test set up in Case Study 1
suggestion
a
and
economic design w s clearly demonstrated in this example.
2 CASE STUDY 1
The first case study involves the testing of a 600mm diameter
continuous flight augered pile sock ted into weathered Ashfield
Shale in Campbelltown, an ut r sou h- s ern suburb of
ydney. The testing as carried out using dynamic technique
th wave matching using the CAPWAP method.
The subsurface strati raphy at this site c mprised 7.3m of
stiff to very stiff compacted clay fill and r sidual soil, underlain
by a thin veneer (0.3m) of ver low to low strength highly to
moderately w athered shale (C ass IV Shal ), followed by
e ium to high strength shale with Point Load Strength Index
typically between 0.5MPa nd 1.5MPa. B sed on a typical
correlation factor of 20 for Sydney Shale and S ndstone
(although the range may be between 10 and 30), th
appr ximate unco fined compr ssiv str gth of the medium to
high strength shale is 10MPa to 30MPa, and the rock was
classified as Class II Shale based on Pells et l (1998). The test
pile was socketed 0.3m through the very low to low str ngth
shale and penetrated only 0.1m into the medium t high t
so that its end bearing pressure can be readily asse sed.
The dynamic load testing wa carried out us ng an 11 tonne
drop hamm
0
10
20
30
40
50
60
70
80
0 20 40 60 80 100 120 140 160 180
Load (MN)
Settlement (mm)
Assessed load‐deformation behaviour up to ultimate load
Maximum design load at settlement of 1% pile dia, based on
detailed load deformation assessment
Load‐def rmation curve constructed assuming settlement = 1% pile
diameter at pile load corresponding to "serviceability" design values
Design with assumed deformatio of 1% using "Serviceability"
Design Values
Figure 2.
The CAPWAP analysis results provided an estimated mobilized
total capacity of 12.39MN, with a mobilized shaft resistance of
1.25MN and a mobilized pile toe resistance of 11.14MN. The
mobilized end bearing resistance therefore corresponded to
39.4MPa. The mobilized pile toe s ttlem nt during th test
blow was less than 6mm and the inf rre static load-
displacement response was rel tively stiff with no
th t the ultimat end bearing sistance was reached.
Based on h test results, a “serviceability” design capacity
of 3.4MN (i.e. 12 MPa end bearing pr ssure) wa adopted. If
the piles had been design d using a presumptive “serviceability”
end b aring pr ssure of 6MPa, the design s rviceability oad
would have be n limited to 1.7MN (i.e. 50% l ss). The benefit
of the dynamic load tes in provid ng design confid nc
may take a majority of the load and the mobilized shaft
resistance, particularly towards the top of the pile shaft, may
reach close to the “ultimate” values.
It can be seen from Tables 1 and 2 that in conventional
working stress terms, the ratio of ultimate end bearing value to
the serviceability value would give rise to equivalent factors of
safety of about 3 for the poorer quality rock, to 10 or more for
Class I Shale and Sandstone. While it may be “safe” to adopt
the presumptive “serviceability” values based on the notion that
settlement will be less than 1% of the minimum footing size,
there is no assessment on “how much less than 1%”. Also, 1%
of a relatively small diameter pile (say 0.6m dia.) would be very
different to 1% of a 2m square footing (i.e. < 6mm compared to
< 20mm settlement).
The difference between conducting a design based simply on
presumptive “serviceability” values and a more detailed
assessment of load-deformation response of a 1.8m diameter
pile socketed 6m into rock (1m in Class V Sandstone, 2m in
Class IV Sandstone, and 3m in Class III Sandstone) is
illustrated in Figure 1 below. In both cases, the ultimate load
capacity of the pile was assessed using the same values (f
su
of
0.1MPa, 0.5MPa and 0.8MPa in Class V, IV and III Sandstone
respectively, and f
bu
of 20MPa for the Class III Sandstone).
Using these parameters, the ultimate load for this pile was
assessed to be 70MN. However, the load-deformation curves
were in one case assessed using the method described by Poulos
(1979), while in the other case as an extrapolation of a linear
line between zero and the assessed ultimate load, with the line
intersecting an assumed settlement of 1% at the pile load
computed using the presumptive “serviceability” design values
given by Pells et al (1998).
Figure 1. Load-deformation curves for Illustrative Example
However, the accurate prediction of pile settlement relies
heavily on knowledge of the foundation material stiffness in
addition to adopting appropriate evaluation methods. Therefore,
the author is of the opinion that using a performance based
design, with pile load testing to validate the load-deformation
response assessed, is more likely to achieve cost-effective
designs, and increase confidence of meeting design objectives.
This performance based design approach is illustrated in two
case studies described below.
wi
th
sh
er and a purpose built testing frame as shown in
igure 2. Dynamic pile load test set up in Case Study 1
2 CASE STUDY 1
The first case study involves the testing of a 600mm diameter
continuous flight augered pile socketed into weathered Ashfield
Shale in Campbelltown, an outer south-western suburb of
Sydney. The testing was carried out using dynamic technique
th wave matching using the CAPWAP method.
The subsurface stratigraphy at this site comprised 7.3m of
stiff to very stiff compacted clay fill and residual soil, underlain
by a thin veneer (0.3m) of very low to low strength, highly to
moderately weathered shale (Class IV Shale), followed by
medium to high strength shale with Point Load Strength Index
typically between 0.5MPa and 1.5MPa. Based on a typical
correlation factor of 20 for Sydney Shale and Sandstone
(although the range may be between 10 and 30), the
approximate unconfined compressive strength of the medium to
high strength shale is 10MPa to 30MPa, and the rock was
classified as Class II Shale based on Pells et al (1998). The test
pile was socketed 0.3m through the very low to low strength
shale and penetrated only 0.1m into the medium to high streng
ale so that its end bearing pressure can be readily assessed.
The dynamic load testing was carried out using an 11 tonne
drop hamm
0
10
20
30
40
50
60
70
80
0 20 40 60 80 100 120 140 160 180
Load (MN)
Settlement (mm)
Assessed load‐deformation behaviour up to ultimate load
Maximum design load at settlement of 1% pile dia, based on
detailed load d fo mation assessment
Load‐deformation curve constructed assuming settl ment = 1% pile
diameter at pile load corresponding to "serviceability" design values
Design with assumed deformation of 1% using "Serviceability"
Design Values
Figure 2.
F
The CAPWAP analysis results provided an estimated mobilized
total capacity of 12.39MN, with a mobilized shaft resistance of


