2911
Technical Committee 212 /
Comité technique 212
0 10 20 30 40 50 60 70
0
500
1000 1500 2000
Q (kN)
w (mm)
DZ1 QZ2 QZ4 QZ9
0 10 20 30 40 50 60 70
0
500
1000 1500
2000
Q (kN)
w (mm)
DZ1L QZ2L QZ4L QZ9L
(a)
(b)
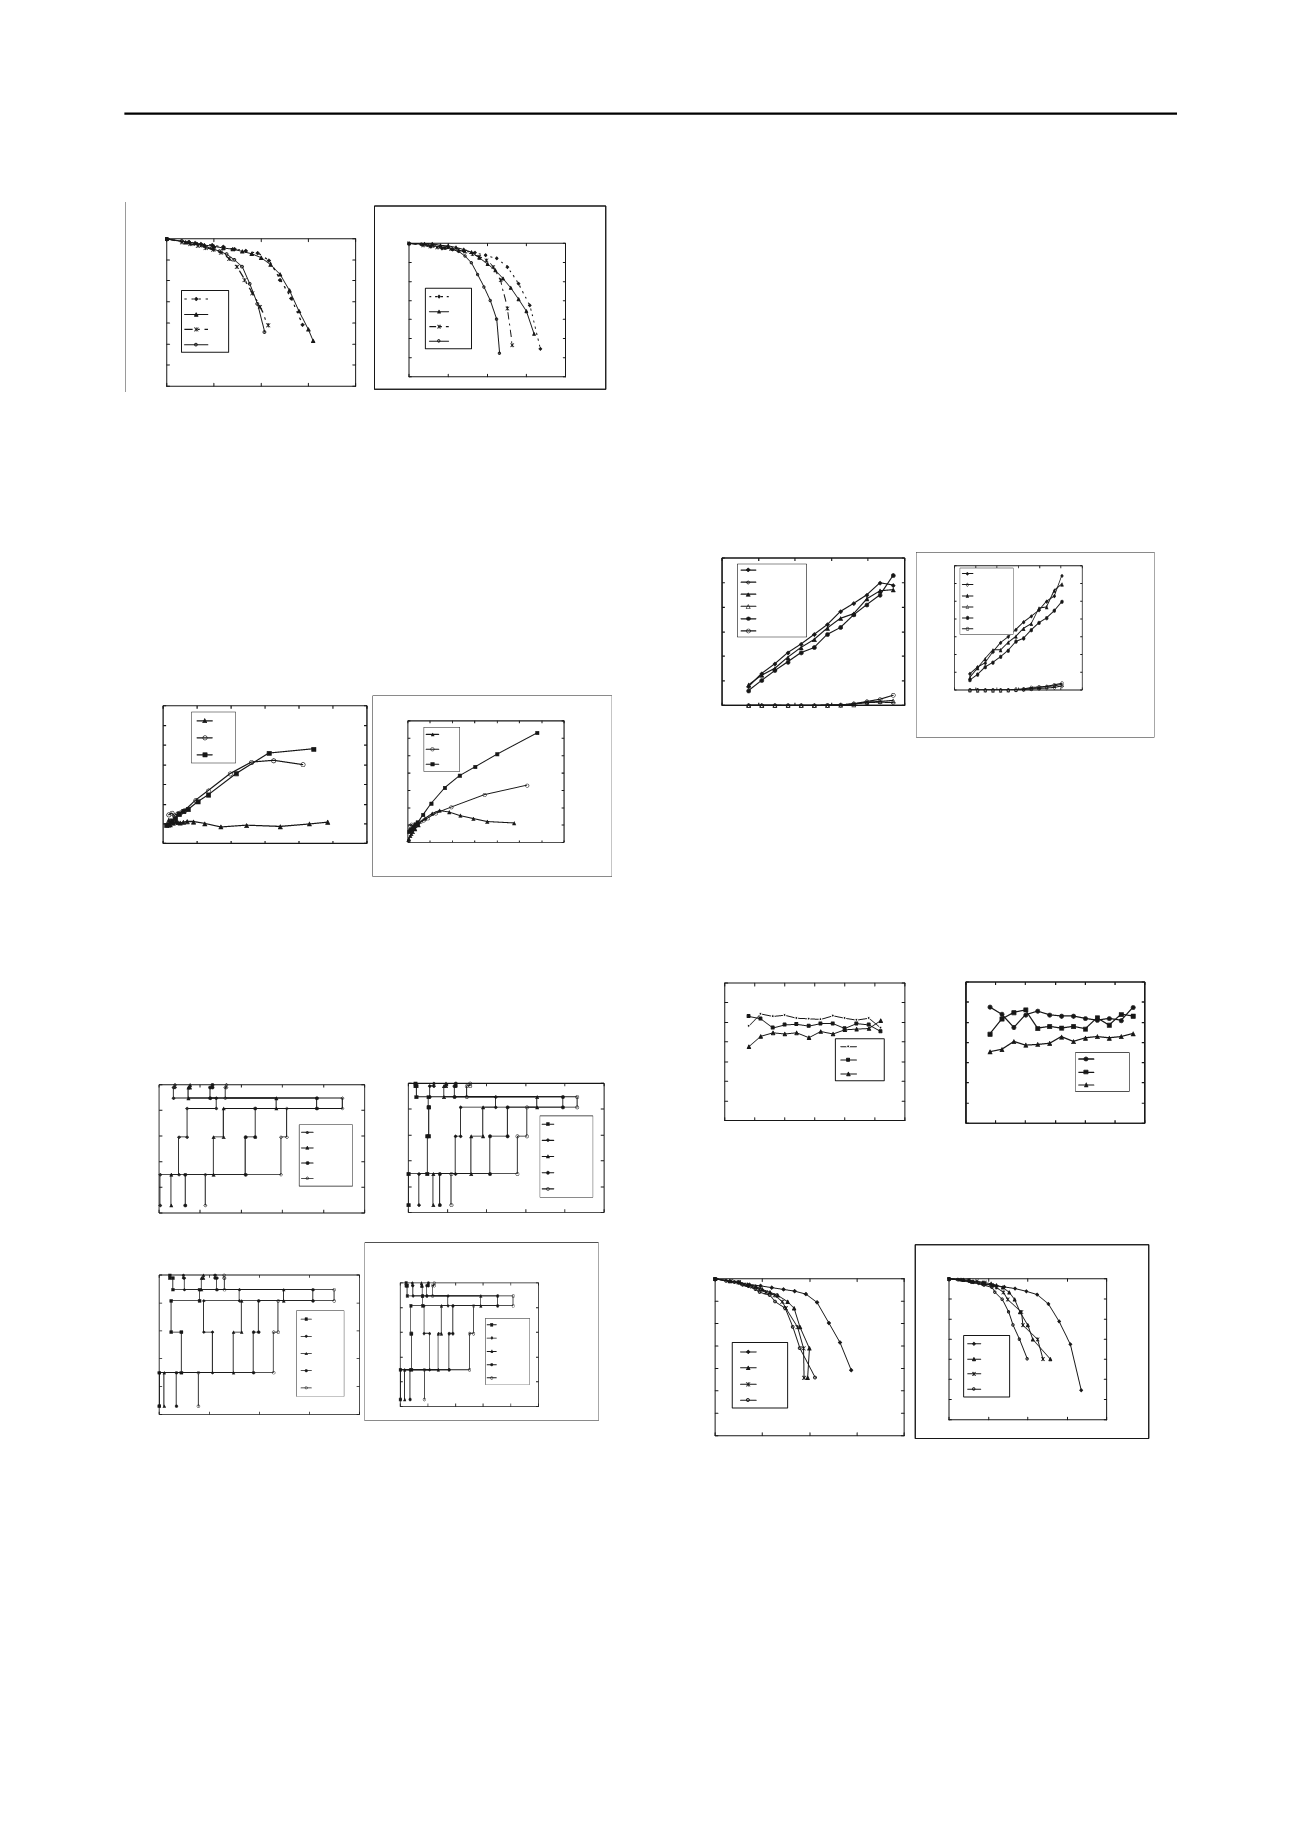
Figure 6. Load-settlement curves for the single pile and the average
load-settlement curves for the pile groups: (a) L = 20 m; (b) L = 24 m.
Figure 7 (a) and (b) show group settlement ratio
R
s
, the ratio
of the settlement of a pile group to that of single pile at the same
average load per pile (Poulos and Davis 1980).The values of
R
s
of both four-pile group and nine-pile group tend to increase with
settlement. The single pile settlement is generally smaller than
the corresponding pile group settlement at the same average
load per pile when the load is relatively large. The
R
s
values for
the two-pile groups are however close to unity. The initial
values of
R
s
(at small loads) are also close to unity, indicating
little interaction between the piles.
0 1 2 3 4 5 6 7
0
10
20
30
40
50
60
Settlement ratioR
s
Pilegroupsettlement (mm)
QZ2 QZ4 QZ9
0 1 2 3 4 5 6 7
0
10
20
30
40
50
60
70
Settlement ratioR
s
Pilegroupsettlement (mm)
QZ2L QZ4L QZ9L
(a)
(b)
Figure 7. Settlement ratio Rs versus pile group settlement for all pile
groups: (a) with L = 20 m; (b) with L = 24 m.
Figure 8 shows the distributions of unit shaft resistance both
for the single pile DZ1L and for some instrumented piles in
groups QZ2L, QZ4L and QZ9L at intermediate load steps
during the load tests.
0 5 10 15 20 25
0
20
40
60
80
100
Depth (m)
Unit shaft resistance (kPa)
280kN 700kN 1120kN 1540kN
0 5 10 15 20 25
0
20
40
60
80
100
Depth(m)
Unit shaftresistance (kPa)
400kN 1200kN 1800kN 2400kN 3000kN
(a)
(b)
0
5
10
15
20
25
0
20
40
60
80
Depth(m)
Unitshaft resistance(kPa)
720kN 1800kN 2880kN 3960kN 5040kN
0 5 10 15 20 25
0
20
40
60
80
100
Depth (m)
Unitshaft resistance (kPa)
1440kN 3600kN 5760kN 7920kN 10080kN
(c)
(d)
Figure 8 Distribution of unit shaft resistance for the single piles and
for the instrumented piles in the pile groups: (a) DZ1L; (b) QZ2L-1; (c)
QZ4L-1; (d) QZ9L-1.
The limit shaft resistances were calculated by using the pile
design methods proposed by Salgado et al. (2011), which
capture the dependence of the unit shaft resistance on the clay
undrained shear strength, the normal effective stress on the pile
shaft and the difference between the critical-state friction angle
and the minimum residual friction angle. Figure 8 shows that
the unit shaft resistance is close to a limit value at shallower
locations, but that is not the case for deeper locations along the
pile. In practical terms, this means that the end of the load tests
on the single piles corresponds to state at which the shaft
resistance mobilized along the entire pile is less than the limit
shaft resistance.
The pile head and base loads versus pile group load are
shown in Figure 9 for piles of the 9-pile groups under different
load levels. The corner piles have the largest pile load, followed
by side and then central piles. This confirms intuition based on
elasticity solutions that if the pile cap is flexible and the loads
on every pile are as a result the same, the center pile with lowest
stiffness would be expected to settle the most, showing that it
has the lowest stiffness. When imposing the same settlement on
all piles, we would therefore expect the center pile to carry the
smallest load, as indeed observed. The experimental results
seem to capture an aspect of pile group response that is not
often commented on. The base of the pile located towards the
center of the group is more constrained because of the
surrounding piles, which may lead to a greater base resistance.
0
200
400
600
800
1000
1200
0
2000
4000
6000
8000
10000
Pile toporbase load(kN)
Pilegroup load(kN)
QZ9‐1:top
QZ9‐1:base
QZ9‐4:top
QZ9‐4:base
QZ9‐5:top
QZ9‐5:base
0
200
400
600
800
1000
1200
1400
0
2000 4000 6000 8000 10000 12000
Pile toporbase load(kN)
Pilegroup load (kN)
QZ9L‐1: top
QZ9L‐1:base
QZ9L‐4: top
QZ9L‐4:base
QZ9L‐5: top
QZ9L‐5:base
(a)
(b)
Figure 9 Pile head and base loads versus pile group load for the nine
pile groups: (a) L = 20 m; (b) L = 24 m
Because of symmetry, the head and base loads for piles in
two-pile and square four-pile groups are expected to be the
same. However, that is not the case for the piles in the nine-pile
groups. The ratio
Q
i
/Q
av
of the individual pile load to the
average individual load in the group is shown in Figure 10. The
load on the outer piles of each group is observed to be greater
than the average load
Q
av
.
0.00 0.20 0.40 0.60 0.80 1.00 1.20 1.40
0 200 400 600 800 1000 1200
Q
av
(kN)
Q
i
/Q
av
QZ9-1
QZ9-4
QZ9-5
0.00
0.20
0.40
0.60
0.80
1.00
1.20
1.40
0 200 400 600 800 1000 1200
Q
i
/Q
av
Q
av
(kN)
QZ9L‐1 QZ9L‐4 QZ9L‐5
(a)
(b)
Figure 10 The ratio
Q
i
/Q
av
of the individual pile load to the average
individual load in nine pile groups: (a) L = 20 m; (b) L = 24 m.
0
10
20
30
40
50
60
70
0
500
1000
1500
2000
Q (kN)
w (mm)
DZ1
QZ9-1
QZ9-4
QZ9-5
0 10 20 30 40 50 60 70
0
500
1000
1500 2000
Q (kN)
w (mm)
DZ1L QZ9L‐1 QZ9L‐4 QZ9L‐5
(a)
(b)
Figure 11 Individual pile load versus group settlement relationship
for the two nine pile groups: (a) L = 20 m; (b) L = 24 m.
Figure 11 shows individual pile load versus group settlement
curves for QZ9 and QZ9L. For comparison, the load-settlement
curves of DZ1 and DZ1L are also shown in Figure 11. For small
group loads, for which linear elastic solutions would be most
applicable, a random load distribution is obtained, with no
definite pattern. When
Q
10%
is approached, there is a
redistribution of the load, and position of the pile within the
group begins to influence the load it carries. Generally, at the
same settlement, the load on an individual pile within the group
is always less than the load for the corresponding single pile.


