2923
Technical Committee 214 /
Comité technique 214
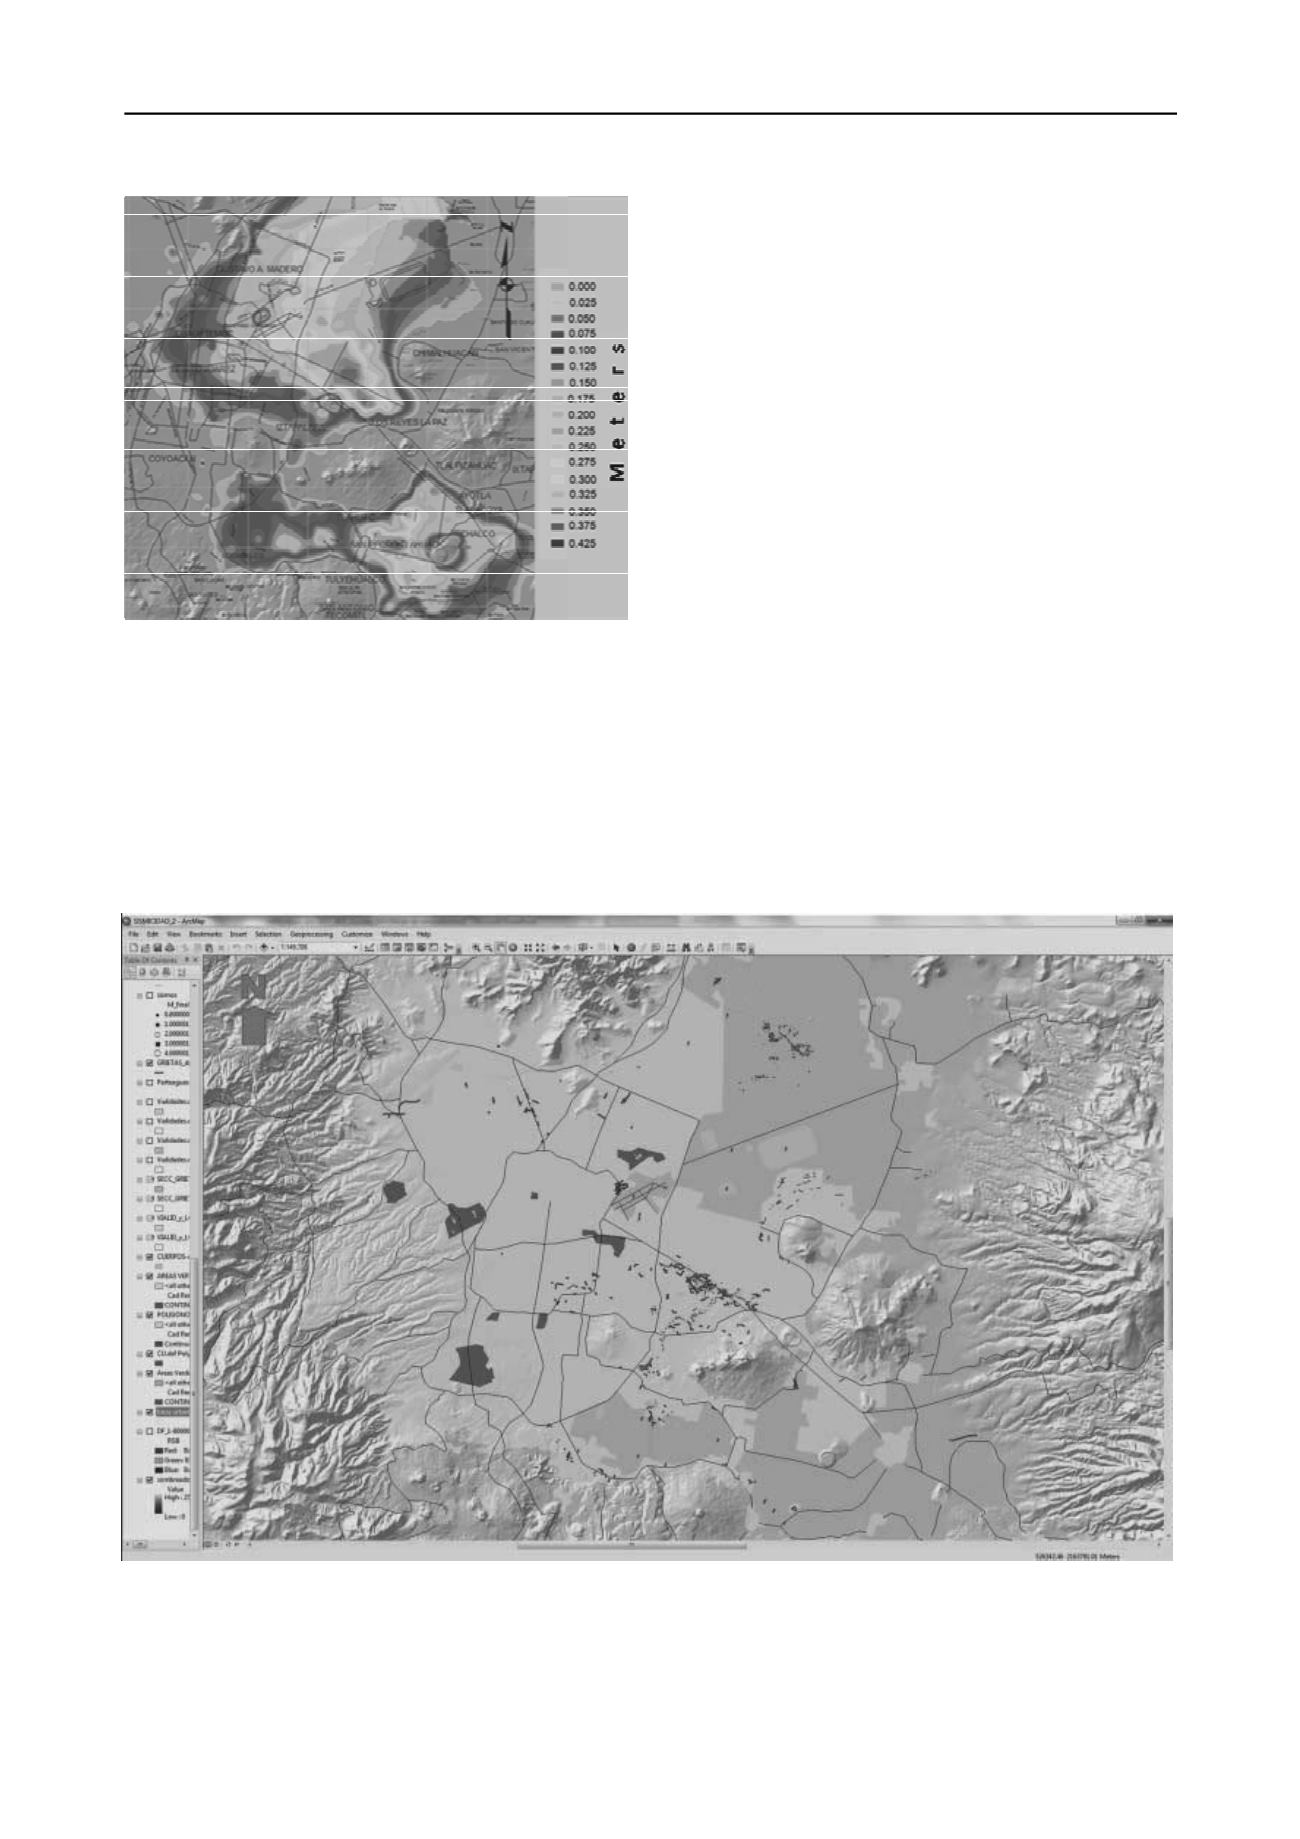
Figure 5. Subsidence rate in m/year during the 1998-2002 period.
2 SOIL FRACTURING
The Geocomputing Laboratory group of the Engineering
Institute, UNAM, has undertaken a systematic study of the
fracturing phenomenon, including both descriptive aspects and
theoretical interpretation. For that purpose, a Geographic
Information System was developed, using as a support a similar
system developed by the authors to describe geotechnical
characteristics of Mexico Basin subsoil (Auvinet
et al
., 1995).
Field work consisting of direct surveys of fractures in situ
was carried out. Use was made of Geodesic control techniques
recurring to differential Global Positioning Systems (GPS)
equipped with double frequency antennas. At this moment, 868
fracturing sites have been documented. About 45 sites where
cracks had been reported were discarded when, during the field
visits, it became evident that no fracturing could be detected and
that defects in the soil surface could be attributed to other
factors (mainly scour).
The amount of information stored in the data base regarding
the exact location as well as the description of the geometric
characteristics and special features of each fracture has
increased steadily. This database has been called: SIG-G. Figure
6 shows the spatial distribution of the 868 sites included until
now in SIG-G.
The most important and destructive cracking mechanism is a
direct result of subsidence. It is observed in abrupt transition
zones between firm and soft soils. Cracks of this type are
characterized by a step toward the compressible zone where
larger settlements are observed (Figure 7). The Iztapalapa
precinct, with 30 kilometers of abrupt transition, is the most
affected by this phenomenon.
Using an extensive photographic file of cracks, a digital
album is being elaborated in order to facilitate the analysis of
evolution of each fracture through the years. This album is
integrated by a set of files; each file contains from two to six
photos of the same crack taken during one of the 1996, 1999,
2001, 2002, 2005, 2006, and 2007 campaigns. A
complementary file includes photos of the damage caused by
the fracture in adjacent buildings or negative effects in the vital
lines of the city.
Figure 6. Spatial distribution of 868 cracks stored until now in SIG-G.


