2922
Proceedings of the 18
th
International Conference on Soil Mechanics and Geotechnical Engineering, Paris 2013
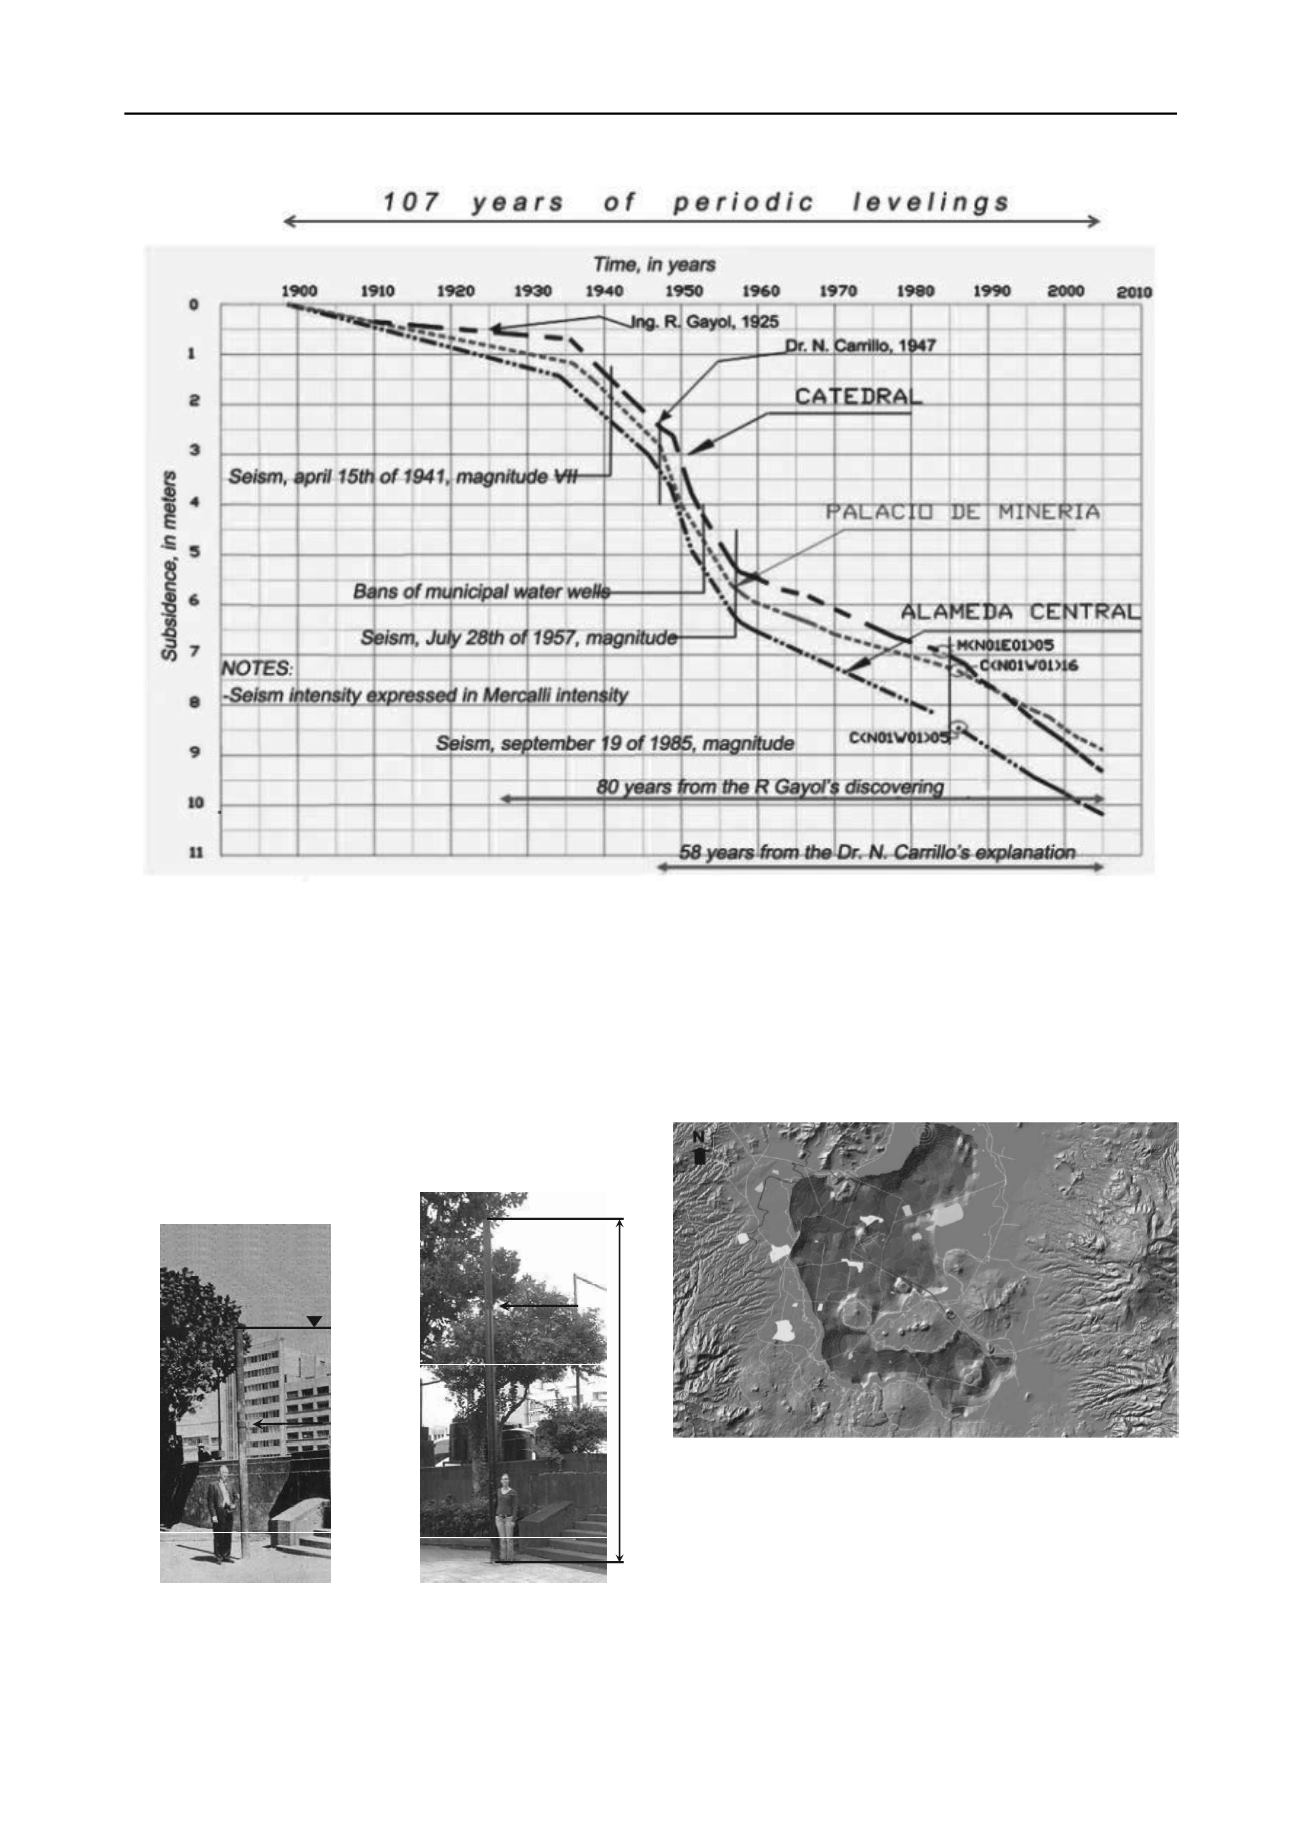
Figure 2. Local evolution of subsidence for the 1898-2005 period.
In the figure 2, it is observed that the subsidence rate reached
a 29cm/year peak during the 1947-1957 period, and is still of
the order 10cm/year for these three sites.
The accumulated settlement since the end of the XIXth
century is of the order of 10m for these sites but, in other points
of the valley, accumulated subsidence values as high as 13.5m
have been observed (Pérez, 2009).
Some physical evidences of the general subsidence such as
former well casings protruding from the subsiding surrounding
soil can be observed in the city (Figure 3). The authorities have
been asked to protect such evidences.
PLAZA DE LA REVOLUCIÓN
1 9 5 0
Coupling
1907
Original
Superfac
2 0 0 7
Coupling
7.23 m
7.20 cm / year
Figure 3. Old well casing protruding from the subsiding soil.
1.3 Spatial distribution of the subsidence phenomenon
In order to assess the spatial distribution of the subsidence in the
former lacustrine area, it was necessary to build a Geographic
Information System (SIG-BN) to process the data obtained from
surveys of the existing benchmarks. Geodesic and topographic
surveys carried out in the middle of the XIXth century were
reviewed and proved to constitute an excellent initial reference
for subsequent measurements. From the contour map obtained
by geostatistical methods it was possible to develop a model of
the present configuration of the surface relief of the bottom of
the former lakes of Mexico valley (Figure 4).
Figure 4. Relief of the former lakes of Mexico Valley.
1.4 Spatial distribution of the subsidence rate
Figure 5 shows the spatial distribution of the subsidence rate for
the 1998-2002 period. The sites with the highest rate (40
cm/year) are located east of Tlahuac, in the Chalco Lake, and in
Nezahualcoyotl City, in front of the Marquez hill.


