2910
Proceedings of the 18
th
International Conference on Soil Mechanics and Geotechnical Engineering, Paris 2013
properties for each layer at this test site are given by Dai et al
(2012).
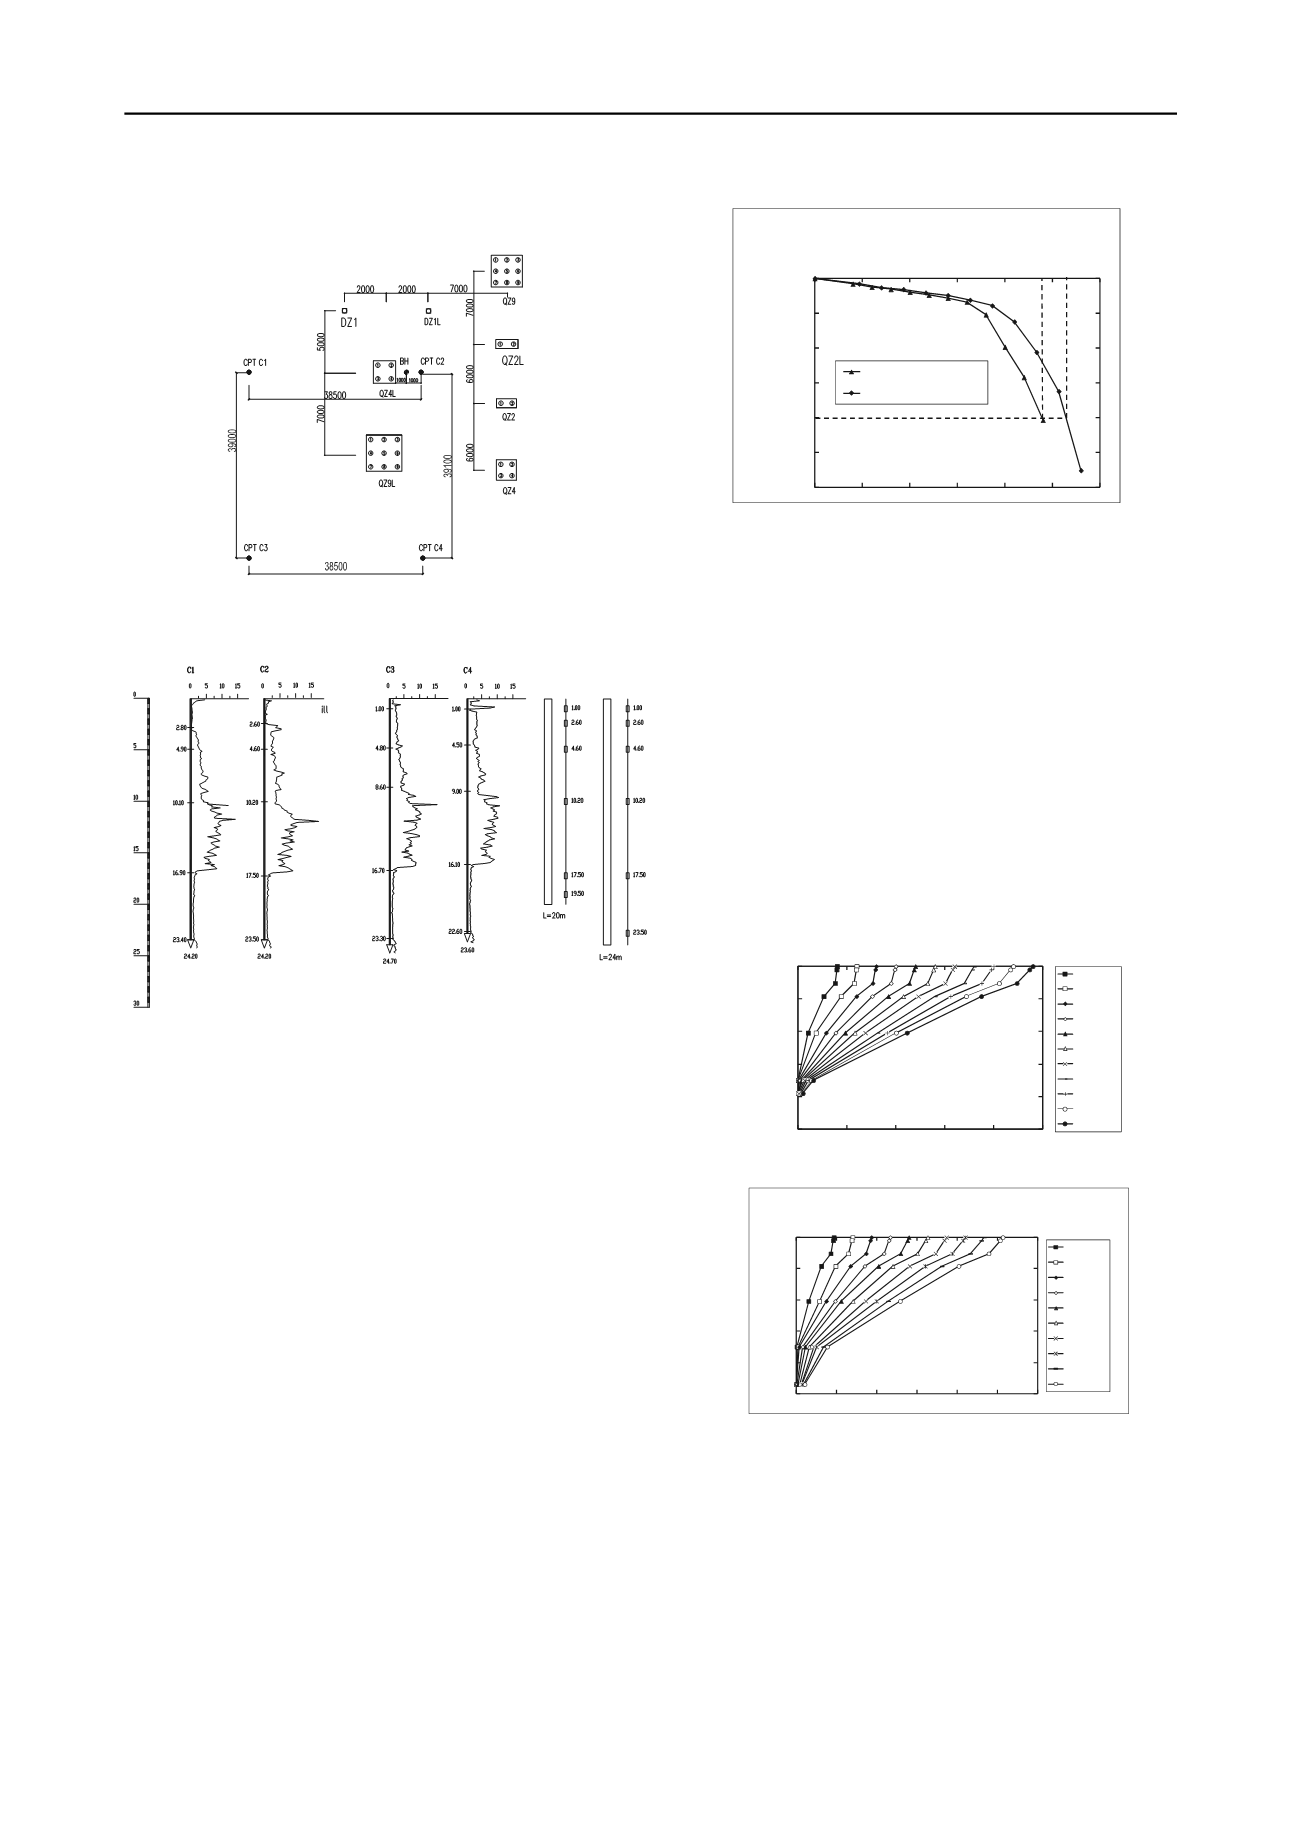
Figure 1. Layout plan of test piles and pile groups ( all dimensions in
millimeters).
Loosef
Stiffplasticclay
Mediumdensesilt
Mediumdensesilt
intermixedwithsiltysand
Softclay
Depth(m)
q
c
(MPa)
q
c
(MPa)
q
c
(MPa)
q
c
(MPa)
Figure 2. The CPT site logs and the layout of strain gauges in the
test piles (all dimensions in meters).
The piles were installed using the slurry method. A 0.4-m-,
0.8-m- or 1.2-m-thick reinforced concrete cap was subsequently
poured on the pile groups and single piles. Figure 1 shows a
layout plan of the test piles and pile groups. The pile caps rested
on the ground and may be considered rigid for practical
purposes. The pile spacing was 2.5B in groups QZ2, QZ4 and
QZ9 and 3.0B in groups QZ2L, QZ4L and QZ9L.
The axial loads transferred along the instrumented piles were
measured by strain gauges, which were installed evenly at each
cross section for all test piles. There were 6 instrumented
sections in each instrumented pile (Figure 2). A vibrating-wire
load cell measured the pile top load of each pile in the pile
groups during the loading process. The load tests were
performed by the kentledge load method. The load tests were
slowly maintained load tests. There were no unload-reload
loops. Load was applied by hydraulic jacks. Settlements were
measured at four locations on the upper surface of the cap by
four displacement transducers.
3 ANALYSIS OF LOAD TEST RESULTS
The load-settlement curves for the two single piles (Figure 3)
show that these two curves are almost identical for
Q
≤ 900 kN,
corresponding roughly to 0.6
Q
ult
, with ultimate bearing capacity
,
Q
ult
, defined based on the traditional 10% relative settlement
criterion (Salgado 2008). For
Q
> 900 kN, the settlement at the
pile top is greater for DZ1 than for DZ1L at the same load. The
ultimate bearing capacity
Q
ult
is 1430 kN for DZ1 and 1540 kN
for DZ1L according to the 10% criterion.
0 10 20 30 40 50 60
0 300 600 900 1200 1500 1800
w (mm)
Q(kN)
DZ1:B=0.4m,L=20m
DZ1L:B=0.4m,L=24m
Figure 3. Load settlement curves for single pile tests.
Figure 4 and Figure 5 show the axial load transfer curves for
DZ1 and DZ1L throughout the loading process. There is
significant transfer of load from the pile to the soil between 2.6
m and 17.5 m for both DZ1 and DZ1L, which makes the
resistance at the pile base for both DZ1 and DZ1L
comparatively small. At the end of the test, the pile head load
for DZ1 is 1440 kN while the pile base load is 31 kN. For
DZ1L, the corresponding numbers are 1540 kN and 62 kN.
These results suggest minimal and potentially zero base
mobilization, which means that essentially all of the loads
applied at the pile head are carried by shaft resistance. So both
pile DZ1 (L/B = 50) and pile DZ1L (L/B = 60) derive their
resistance from shaft resistance at values of relative settlement
conventionally associated with the ultimate load. Complete
shaft resistance mobilization in friction piles crossing soft soil
layers may require large pile head settlement because of large
axial pile compressibility.
0 5 10 15 20 25
0
300
600
900
1200
1500
Depth (m)
Load (kN)
240kN 360kN 480kN 600kN 720kN 840kN 960kN 1080kN 1200kN 1320kN 1440kN
Figure 4. Axial force distribution for 20m-long single pile.
0 5 10 15 20 25
0
300
600
900 1200 1500 1800
Depth (m)
Load (kN)
280kN 420kN 560kN 700kN 840kN 980kN 1120kN 1260kN 1400kN 1540kN
Figure 5. Axial force distribution for 24m-long single pile.
Figure 6(a) shows the load-settlement curves for the single
pile and the average load-settlement curves for the pile groups
with L = 20 m. The average load per pile in a group is less than
the load on a single pile at the same settlement except for pile
group QZ2. This exception is likely caused by variability in the
soil properties around that group or some variability in
construction. The equivalent figure for L = 24 m is Figure 6
(b),
which shows a much more clear separation between the
responses of the single pile and the average response of each
pile group.


