2916
Proceedings of the 18
th
International Conference on Soil Mechanics and Geotechnical Engineering, Paris 2013
the Cherry Island Landfill, located in the USA, in Wilmington,
Delaware.
Müller and Larsson (2013) investigate and discuss the
differences between six of the available analytical models to
evaluate the average degree of consolidation U describing the
characteristics of the disturbed zone around prefabricated
vertical drains (eq 1), and evaluate the influence on the results
of the variables incorporated in these models.
F
xT
h
e U
8
1
−
−=
(1)
where
T
= c
× t d
⁄
is the time factor for horizontal
consolidation,
c
= k
× M
γ
⁄
is the undisturbed horizontal
coefficient of consolidation in the clay,
t
is the consolidation
time,
d
is the diameter of the assumed unit cell dewatered by a
single drain and the expression
F
is dependent on the model.
The influence of each variable
x
i
(i.e.
F
,
T
h
and
κ
) on can be
assessed through the parameter
α
:
=
∑
(2)
The authors concluded that “although more realistically
models may capture the nature of the smear zone, the impacts
on the assessment of U of the more complex models are
insignificant under the assumptions made in this paper.
Hansbo´s simplified model “is still useful for practical
engineering purposes due to its simplicity”. They also state that
“it is more important to put an effort into reducing the
uncertainty in
c
h
the trying to investigate
s
and
m
in ordinary
engineering projects”.
Juárez-Badillo (2013) applies his general time-settlement
equation (eq 3), provided by his principle of natural
proportionality on the evaluation of settlements in soft soils for
the Kansai International Airport.
=
∗
(3)
(3)
where
t*=t
at
S
=
1/2S
T
, and
S
T
and
d
are parameters which
may be obtained from experimental data. Using experimental
data from Kansai International Airport and calibrating his
equation, his estimates of total settlements in the long term tend
to be similar to the observed data.
3 CONSTRUCTIVE PROCESS
Lui
et al.
(2013) study the application of X-section cast-in-situ
concrete piles as a method for improving soft soils. They
describe a construction method with a special pile-driving
machine. The quality of piles driven with this machine was
verified excavating the surrounding soil. They also used static
and low-strain integrity testing methods making reference in all
the process to the amount of concrete poured during concreting.
A large scale model test program was carried out on X concrete
piles and circular ones, to obtain the load transfer behavior of
both pile types under three different loading modes:
compression, uplift, and lateral loads. The authors also report
the results of a field test.
Lui and his co-workers reached concluded that X piles have
a larger contact area at the pile-soil interface and a larger inertia
factor or lateral stiffness (
EI
) than circular piles for the same
volume of concrete used.
4 DETERMINATION OF MECHANICAL PROPERTIES
OF SOFT SOILS
Two papers were presented regarding about this issue:
Equihua-Anguiano and Orozco-Calderón (2013) estimated
the undrained shear strength of marine soft soils based on the
vertical penetration of a horizontal cylinder of 3.35 to 9m long
and 1 to 2m in diameter, using steel and PVC tubes. An
experimental program was carried out to validate the results of
this device using a large rigid tank where a reconstituted marine
soft soil was placed. The undrained shear strength was
estimated from the analysis of the penetration of the cylinder
and from miniature vane shear tests. The results show that the
two methods yield similar values of the undrained shear
strength.
Bobei and Locks (2013) present the results and
interpretations of data collected during the procurement phase
of a motorway upgrade in New Zealand. The strength and
consolidation characteristics are investigated for a soil identified
as a sensitive soft soil, Late Pleistocene–Holocene marine
sediment. The estimate of undrained shear strength based on
empirical methods is found to have limitations to predict the
undrained shear strength of the sensitive soil. The authors
propose that one-dimensional compression response of the
virgin sensitive may be estimated using a relationship between
the liquidity index and the vertical effective stress. The
predictive capability of this relationship is demonstrated by
numerical simulations of settlement monitored during the
construction and post-construction phase of the original SH16
motorway embankment. The soil sensitivity represents an
indicator of soil micro-structural bonding or development of
inter-particle forces between particles or their aggregates. The
disturbance to the soil structural bonding during loading could
have some serious consequences such as: (a) strength reduction;
and (b) changes in the overall soil behaviour due to an increase
in soil compressibility properties.
The measure of soil sensitivity (
S
t
) adopted in this study is
based on the ratio between peak undisturbed strength (
s
u
) and
the remould strength (
s
r
) when the soil reaches its residual state.
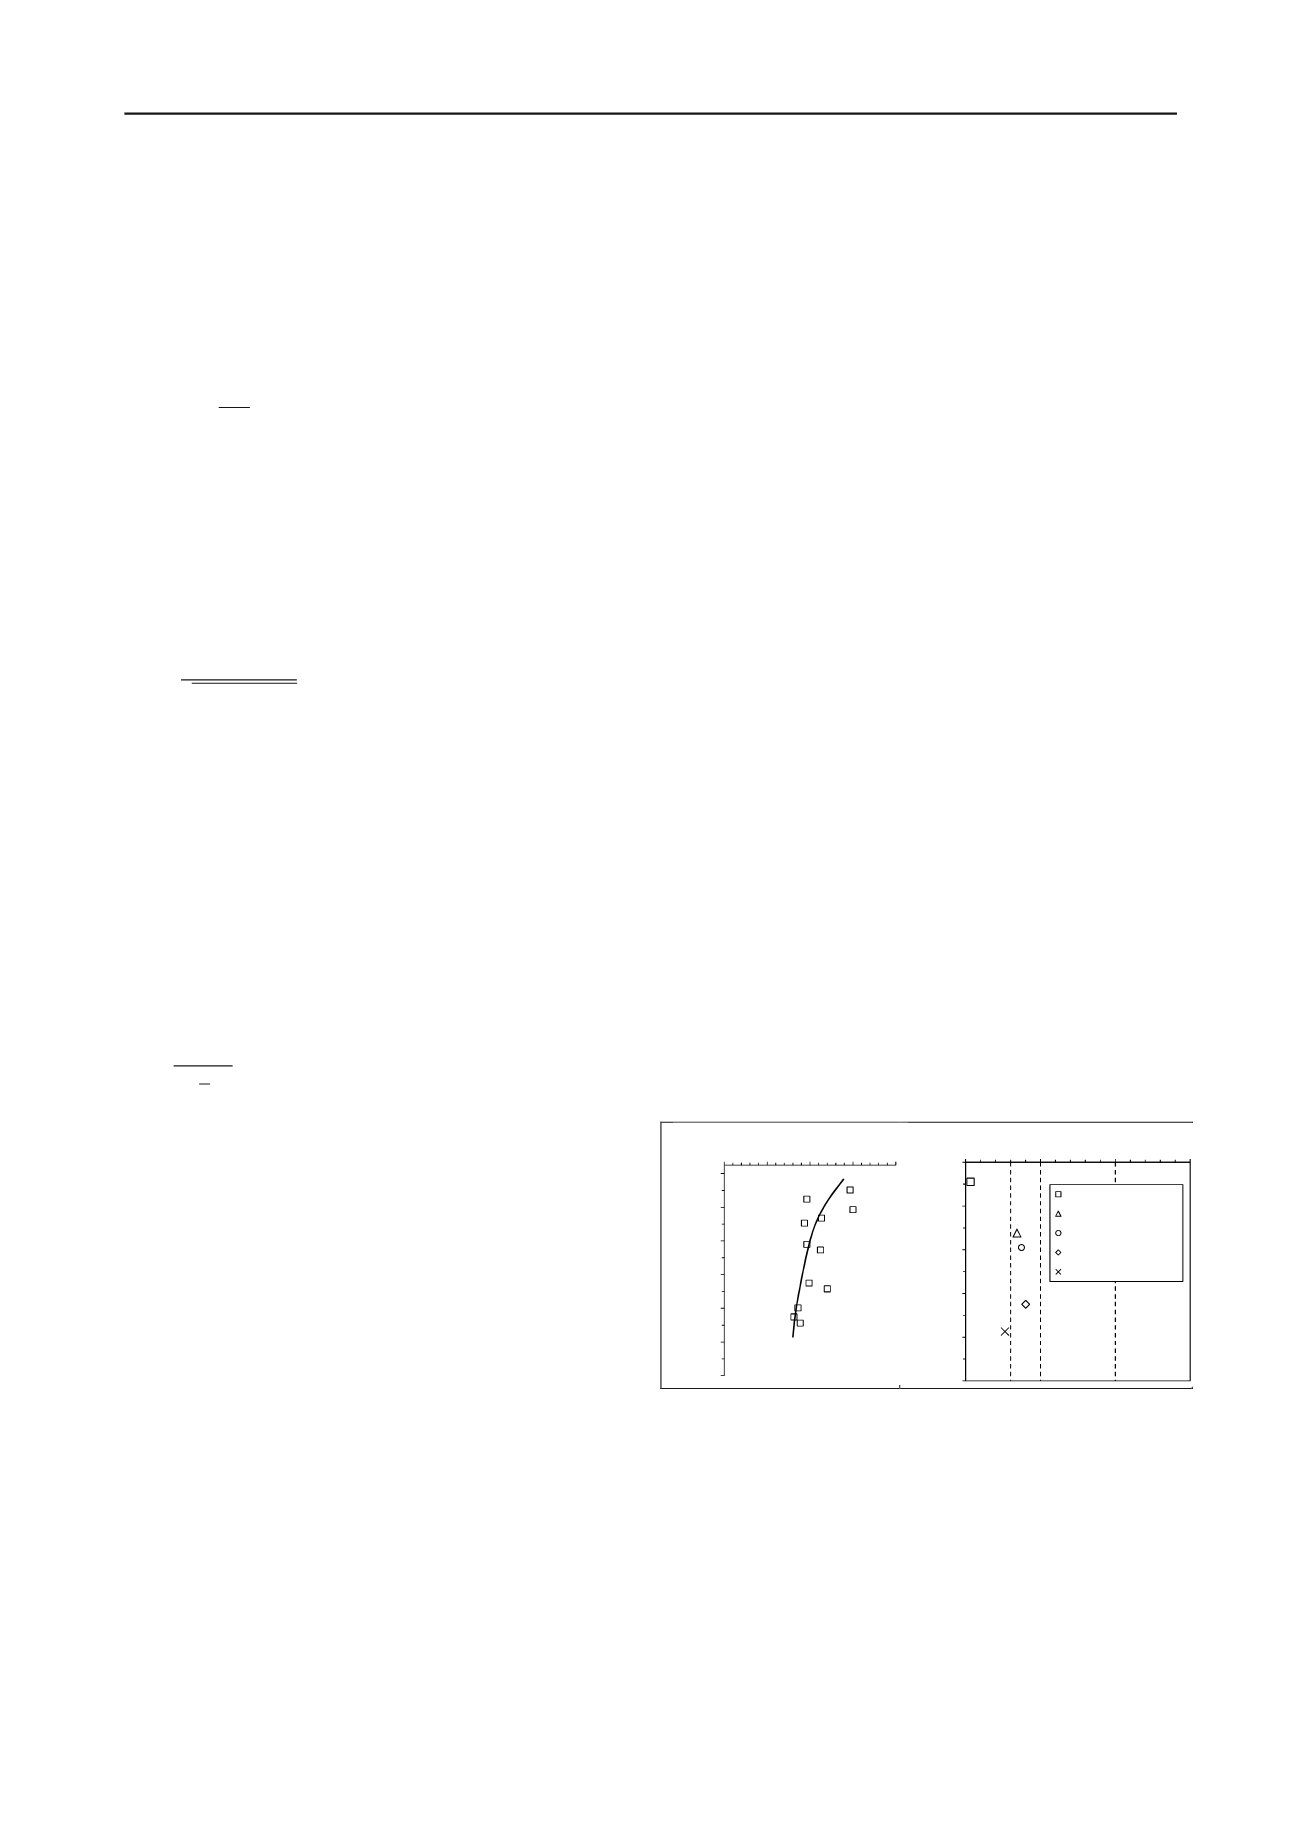
The results of shear vane tests were interpreted to determine the
strength sensitivity manifested by virgin AH soil as shown in
Figure 1b.
Figure 1. (a) Variation of liquidity index with depth; (b) Sample quality
assessment based on (Lunne
et al
. 1997) classification system.
The main findings of the paper are summarized below:
The undrained shear strength of virgin sensitive
soils increase linearly with depth.
The compressibility of virgin AH soil in one-
dimensional
testing
displays
non-linear
characteristics when stresses exceed the pre-
consolidation pressure.
The assessment of undrained shear strength of
virgin AH soil is not readily predicted by methods
such as SHANSEP.
The one-dimensional response of virgin AH soil is
found to uniquely relate
LI
and
σ
’
v
. The predictive
capability of a proposed relationship is
-12.5
-10.5
-8.5
-6.5
-4.5
-2.5
-0.5
0.0
0.5
1.0
1.5
2.0
Relative Level - RL (m)
Liquidity Index - LI
-10.0
-8.0
-6.0
-4.0
-2.0
0.0
0.00
0.05
0.10
0.15
Relative Level: RL (m)
∆
e/e
o
BH22A: RL=-0.9m
BH31C: RL=-3.2m
Newland (1955): RL=-3.9m
DH423: RL=-6.3m
BH31B: RL=-7.7m
Very Poor
Poor
Good to Fair
V Good -Excellent
(a)
(b)


