 
          2926
        
        
          Proceedings of the 18
        
        
          th
        
        
          International Conference on Soil Mechanics and Geotechnical Engineering, Paris 2013
        
        
          overconsolidated soils present in the underlying Tauranga
        
        
          Group alluvium.
        
        
          In the Causeway Section, the depth of the Holocene layer is
        
        
          typically 12.0m to 13.0m, with a reduced depth of 1.5m where
        
        
          the ECBF rock head is present at a shallow depth.
        
        
          4 UNDRAINED SHEAR STRENGTH
        
        
          The undrained shear strength was assessed by in-situ testing
        
        
          methods such as: (a) field shear vanes; and (b) piezocones
        
        
          (CPTu).
        
        
          The field shear vanes are commonly used to determine the
        
        
          undrained shear strength (s
        
        
          u
        
        
          ) of soft to medium stiff clays.  In
        
        
          this project, a typical field vane was used with a diameter of 50
        
        
          to 65mm and a height to diameter ratio of 2.
        
        
          The piezocone testing was conducted using a standard cone:
        
        
          cone angle of 60 degrees, a cross-sectional area of 10 cm
        
        
          2
        
        
          , and a
        
        
          porous element located immediately behind the cone.  The cone
        
        
          was advanced during field probing at a standard rate of
        
        
          20mm/sec.  The data was measured electronically to include the
        
        
          tip resistance (q
        
        
          c
        
        
          ), sleeve friction (f
        
        
          s
        
        
          ) and the penetration pore
        
        
          water pressure (u).  The cone correction factor (N
        
        
          k
        
        
          ) for
        
        
          estimatesof s
        
        
          u
        
        
          values, was assessed based on correlations
        
        
          against the field shear vane test results.
        
        
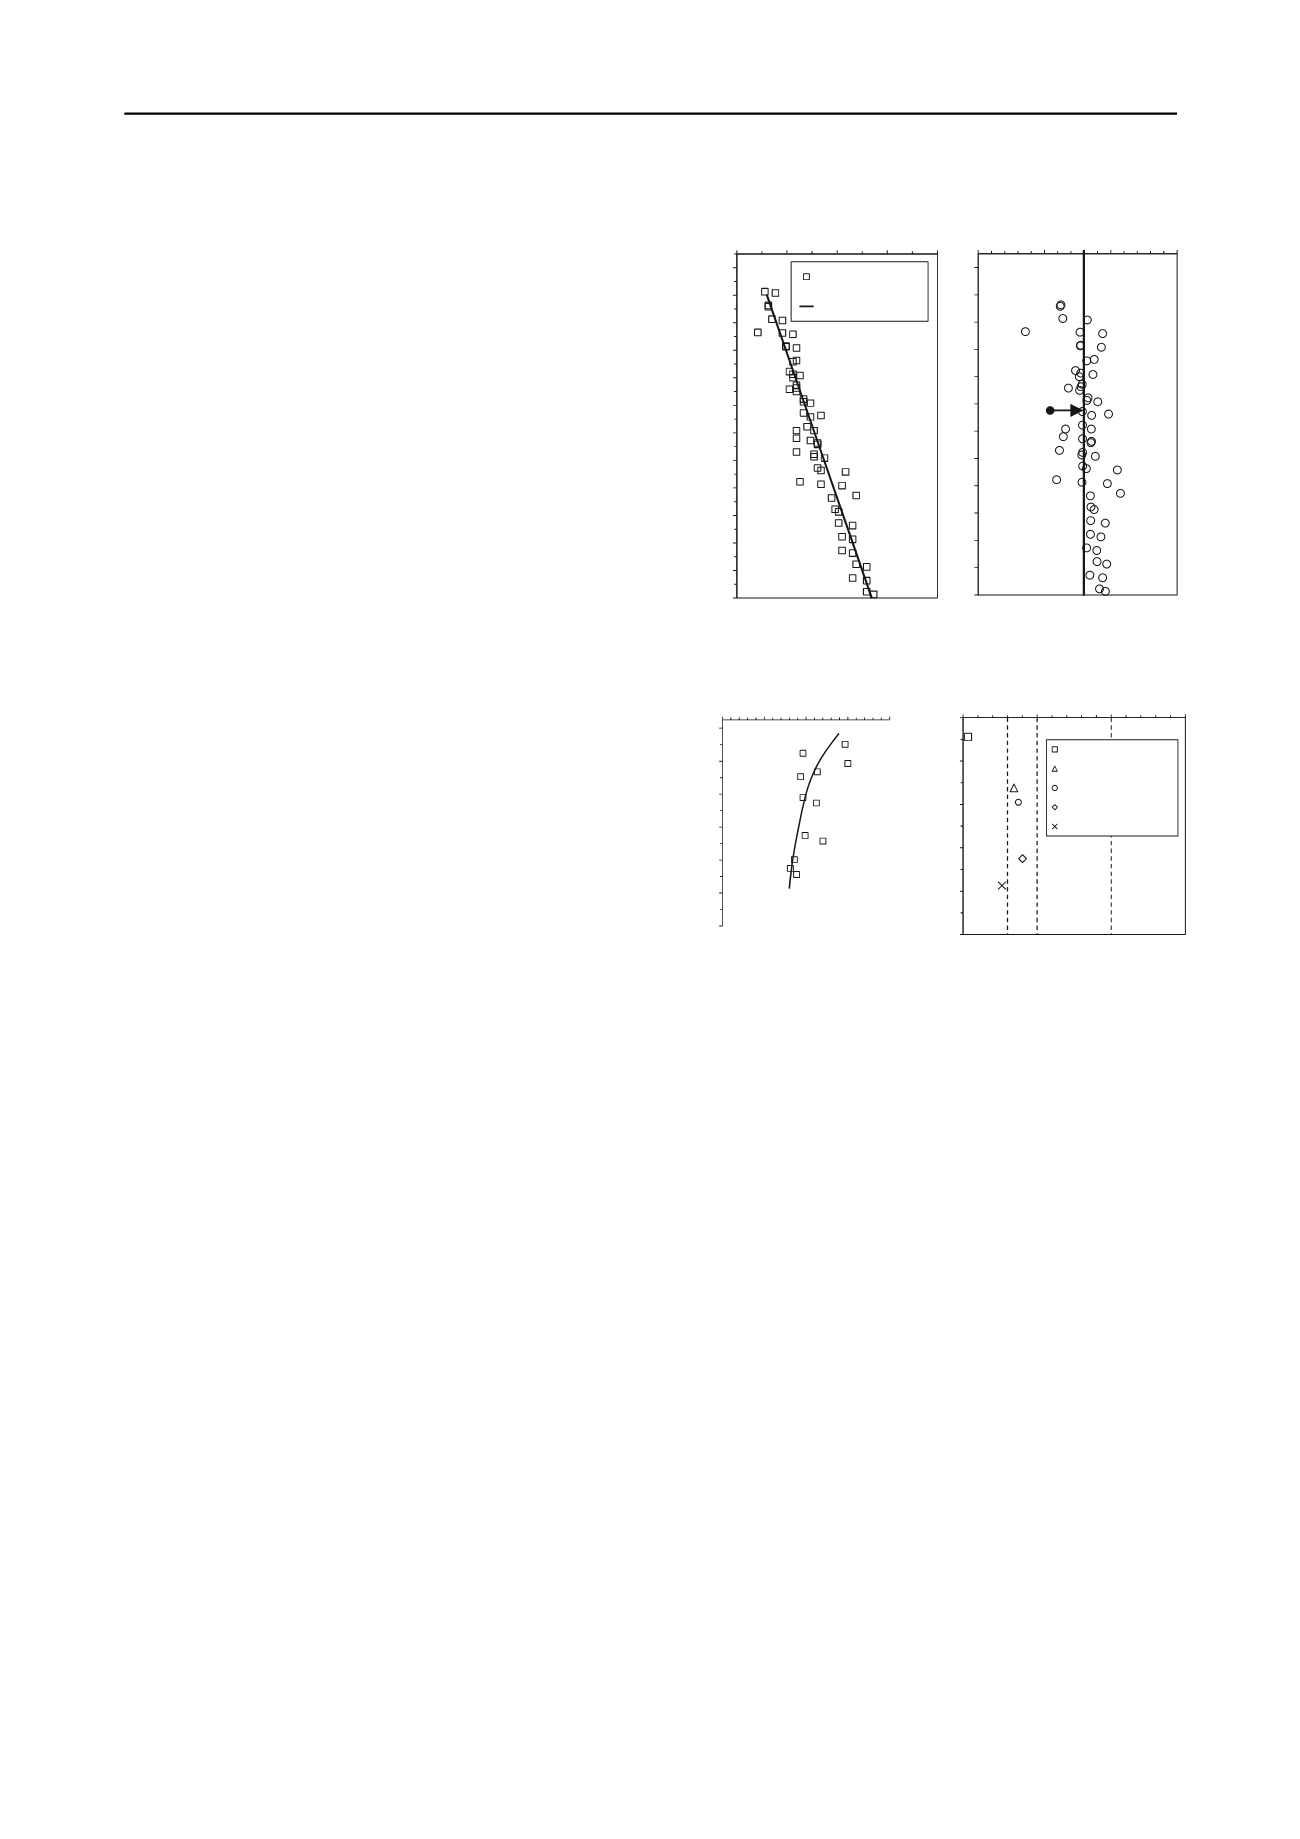
          The shear vane profile for the virgin AH soil is presented in
        
        
          Figure 1a.  All shear vane readings were corrected adopting the
        
        
          empirical correction factor (


          ) recommended by (Bjerrum
        
        
          1973).  The undrained shear strength is showing an increasing
        
        
          trend with depth in accordance with a linear relationship that
        
        
          can be expressed as follows:


            depth


            s


            u


          9.16
        
        
          (1)
        
        
          5 SOIL SENSITIVITY
        
        
          The soil sensitivity represents an indicator of soil micro-
        
        
          structural bonding or development of inter-particle forces
        
        
          between particles or their aggregates.  In this study these effects
        
        
          are referred to as structural bonding.  The disturbance to the soil
        
        
          structural bonding during loading could have some serious
        
        
          consequences such as: (a) strength reduction; and (b) changes in
        
        
          the overall soil behaviour due to an increase in soil
        
        
          compressibility properties.
        
        
          The measure of soil sensitivity (S
        
        
          t
        
        
          ) adopted in this study is
        
        
          based on the ratio between peak undisturbed strength (s
        
        
          u
        
        
          ) and
        
        
          the remould strength (s
        
        
          r
        
        
          ) when the soil reaches its residual state.
        
        
          The results of shear vane tests were interpreted to determine the
        
        
          strength sensitivity manifested by virgin AH soil as shown in
        
        
          Figure 1b.
        
        
          Several classifications of soil sensitivity have been proposed
        
        
          in the technical literature.  According to (Rosenqvist 1953) the
        
        
          AH soil falls in the range of a Very Sensitive soil (i.e. 4 < S
        
        
          t
        
        
          <
        
        
          8).
        
        
          6 ATTERBERG LIMITS
        
        
          The consistency limits, liquid limit (LL) and plasticity limits
        
        
          (PL), besides serving the basic means of soil classification, they
        
        
          have also been shown to provide estimates of strength and
        
        
          deformation parameters via empirical correlations (Wroth and
        
        
          Wood 1978, among many others).
        
        
          For this project, the method to assess the LL has adopted the
        
        
          “fall cone” method for the AH soils.  The PL was determined by
        
        
          the method of thread rolling according to BS 1377-2:1990.
        
        
          Figure2a shows the liquidity index (LI) for a soil profile at
        
        
          Chainage 1,860m.  The values of LI are generally greater than 1
        
        
          which is indicative of a soil micro-fabric that is able to
        
        
          accommodate additional resistance over the remoulded state due
        
        
          to development of structural bonds.


            ‐12.5


            ‐11.5


            ‐10.5


            ‐9.5


            ‐8.5


            ‐7.5


            ‐6.5


            ‐5.5


            ‐4.5


            ‐3.5


            ‐2.5


            ‐1.5


            ‐0.5


            0


            10


            20


            30


            40


            0


            5


            10


            15


            Strength Sensitivity ‐ S


            t


            Relative Level ‐ RL(m)


            Shear Strength ‐ s


            u


            (kPa)


            Field Shear Vane


            Linear Strength Increase


            (a)


            (b)


            S


            t


            ≈ 8


          Figure 1.  (a) Undrained shear strength profile; and (b) Soil sensitivity
        
        
          profile.


            ‐12.5


            ‐10.5


            ‐8.5


            ‐6.5


            ‐4.5


            ‐2.5


            ‐0.5


            0.0


            0.5


            1.0


            1.5


            2.0


            Relative Level ‐ RL (m)


            Liquidity Index ‐ LI


            -10.0


            -8.0


            -6.0


            -4.0


            -2.0


            0.0


            0.00


            0.05


            0.10


            0.15


            Relative Level: RL (m)


            Δe/e


            o


            BH22A: RL=-0.9m


            BH31C: RL=-3.2m


            Newland (1955): RL=-3.9m


            DH423: RL=-6.3m


            BH31B: RL=-7.7m


            Very Poor


            Poor


            Good to Fair


            V Good ‐Excellent


            (b)


            (a)


          Figure 2.  (a) Variation of liquidity index with depth; (b) Sample quality
        
        
          assessment based on (Lunne et al. 1997) classification system.
        
        
          7 SAMPLE DISTURBANCE
        
        
          An evaluation of the soil sample quality is essential, as
        
        
          disturbance may lead to a laboratory measured soil behaviour
        
        
          that is different from its in-situ response.  Efforts were made to
        
        
          minimize the sample disturbance, but it inevitably occurs due to
        
        
          stress changes associated with soil sampling.
        
        
          (Lunne et al. 1997) proposed to estimate the quality of soil
        
        
          samples based on the ratio


          e/e
        
        
          0
        
        
          , where the change in void ratio


          e is measured during soil re-consolidation phase to in-situ
        
        
          vertical stress


          ’
        
        
          v0
        
        
          with consideration of void ratio e
        
        
          0
        
        
          at the
        
        
          beginning of this phase.
        
        
          Figure 2b presents an assessment of soil sample quality of
        
        
          “reliable” oedometer tests (i.e. sample designation falling in the
        
        
          range of good to excellent).  Given the very soft consistency of
        
        
          the virgin AH soil, a significant number of samples were found
        
        
          to have an undesirable quality.
        
        
          For brevity and clarity of the paper presentation these values
        
        
          have not been included in Figure 2b, and the associated
        
        
          oedometer and triaxial test results have been discarded from
        
        
          further consideration.
        
        
          8 OEDOMETER TESTS
        
        
          The tests were carried out using a fixed-ring oedometer with
        
        
          drainage allowed at top and bottom of the test soil sample.  The
        
        
          soil samples were 31mm in diameter and 16mm in height.  The
        
        
          settlement of the soil sample was monitored by a Linear
        
        
          Vertical Displacement Transducer (LVDT).  Each load
        
        
          increment was applied over a time period of 24 hours, with the
        
        
          end of primary consolidation determined using the square-root-
        
        
          of-time method (Taylor 1942).