 
          2927
        
        
          Technical Committee 214 /


            Comité technique 214


          An AH sample was vigorously remoulded on a glass plate
        
        
          using a spatula to form a soil slurry at a water content equal to
        
        
          the liquid limit (Burland 1990).
        
        
          The results of AH oedometer tests are presented in Figure 3
        
        
          in a semi-logarithmic plot of void ratio, e, against the logarithm
        
        
          of the vertical effective stress, log(


          ’
        
        
          v
        
        
          ). The virgin AH soil
        
        
          manifests initially a negligible amount of compression before
        
        
          reaching the pre-consolidation stress,


          ’
        
        
          p
        
        
          .  When the stress
        
        
          values exceed


          ’
        
        
          p
        
        
          , the consolidation curve displays a non-linear
        
        
          response with a gradient significantly higher compared to the
        
        
          remoulded sample.  At high pressures, the compression curve of
        
        
          virgin soil is seen to approach the remould consolidation line in
        
        
          an asymptotic trend.


            1.0


            1.5


            2.0


            2.5


            3.0


            3.5


            4.0


            4.5


            10


            100


            1,000


            BH22A: RL=‐0.9m


            BH31C: RL=‐3.2m


            Newland(1955): RL‐ 3.9m


            DH423: RL=‐6.3m


            BH31B: RL=‐7.7m


            Remould Sample


            Vertical Stress ‐


            '


            v


            (kPa) 


            Void Ratio ‐ e


          Figure 3. One-dimensional consolidation test results.
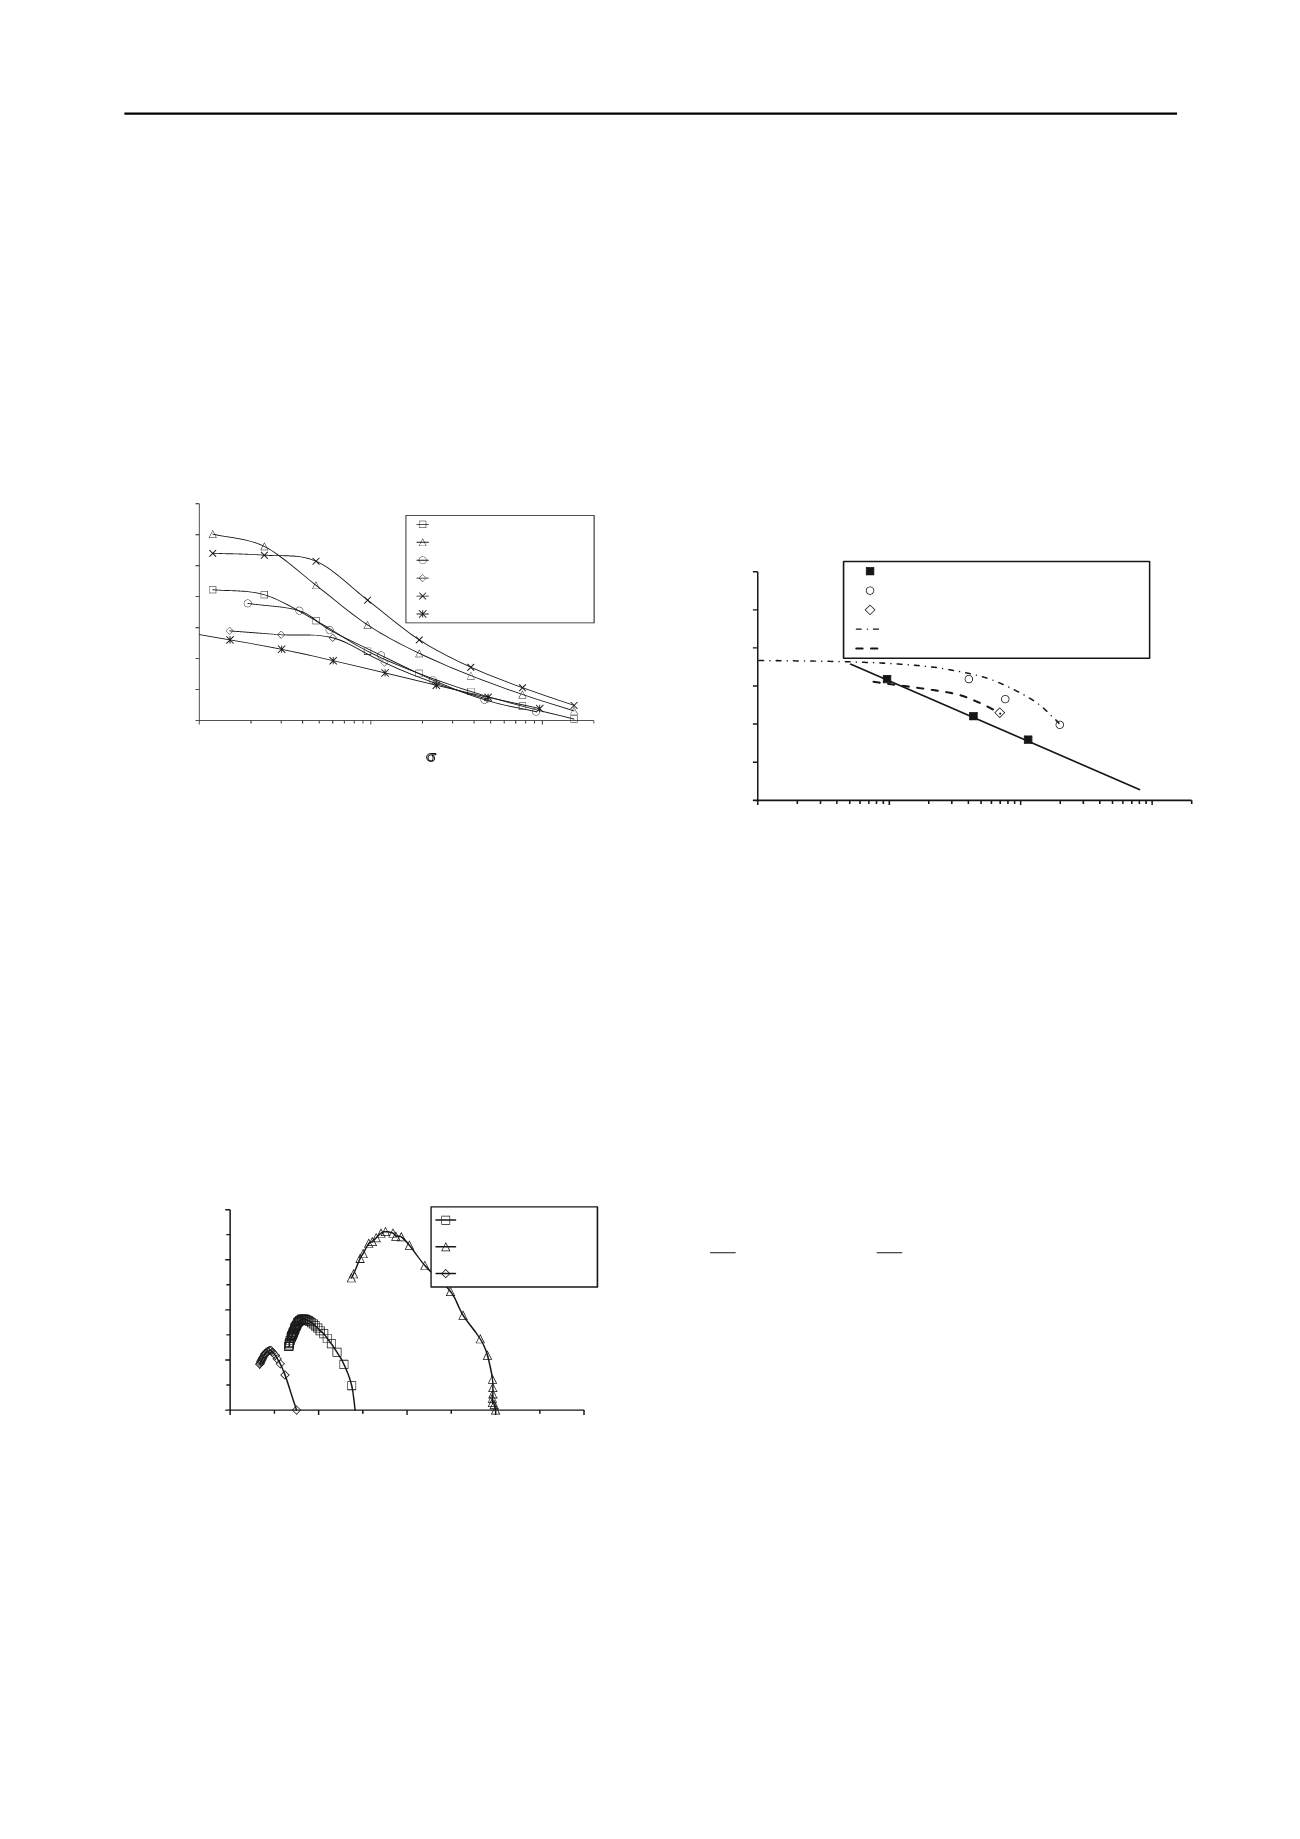
        
        
          9 TRIAXIAL TESTS
        
        
          The triaxial tests were carried out on virgin soil samples of
        
        
          diameters varying between 50 and 70mm.  For all the tests the
        
        
          sample saturation was achieved by raising the back pressure to a
        
        
          maximum of 300kPa. Over the duration of saturation, the stress
        
        
          state was maintained at an effective stress of 20kPa.  Full
        
        
          saturation was achieved when Skempton’s pore pressure
        
        
          parameter B has achieved a value equal or greater than 95%.
        
        
          On completion of soil saturation, the samples were
        
        
          isotropically consolidated before the start of undrained shearing.
        
        
          The undrained shearing was conducted in a deformation
        
        
          controlled mode to large axial strains between 15 to 20%.
        
        
          Figure 4 presents the results of undrained shearing as plots
        
        
          of effective stress paths: deviatoric stress q =


          ’
        
        
          1
        
        
          -


          ’
        
        
          3
        
        
          vs. mean
        
        
          effective stress p’ = (


          ’
        
        
          1
        
        
          +2


          ’
        
        
          3
        
        
          )/3.


            0


            50


            100


            150


            200


            0


            100


            200


            300


            400


            Deviatoric Stress: q (kPa)


            Mean Effective Stress: p' (kPa)


            DH522: RL=-4.3m


            DH503: RL=-4.4m


            DH525: RL=-5m


          Figure 4.  Effective stress paths of AH soil samples in undrained
        
        
          shearing for a range of confining pressures p’
        
        
          0
        
        
          = 75 to 300 kPa.
        
        
          The behaviour manifested by the virgin AH soil is of a
        
        
          contractive type. The stress paths climb to a maximum
        
        
          deviatoric stress, q
        
        
          max
        
        
          , before plummeting towards the origin of
        
        
          the stress path.  The strain softening past q
        
        
          max
        
        
          is a distinctive
        
        
          feature of this suite of tests.
        
        
          10 CRITICAL STATE
        
        
          The critical state is a fundamental concept in soil mechanics as
        
        
          it represents a reference state to assess the state and behaviour
        
        
          of soil under loading.  It was firstly introduced by (Roscoe et al.
        
        
          1958) to describe the behaviour of remoulded clays, and
        
        
          nowadays the concept was extended to represent a more general
        
        
          framework of soil behaviour for: (a) Sands (Been et al 1991);
        
        
          and(b) Combinations of sand with various percentages of plastic
        
        
          and non-plastic fines (Bobei et al. 2009).
        
        
          The results of undrained triaxial tests conducted on AH soil
        
        
          are interpreted in the framework of critical state as illustrated in
        
        
          Figure 5.  The soil samples were considered to reach the critical
        
        
          state when the following conditions are satisfied: dq=0, dp’=0,
        
        
          du =0 while d


          q
        
        
          ≠0.
        
        
          The CS is found to plot along a linear relationship.  On
        
        
          consideration of initial soil state being located above the CS
        
        
          line, and the contractive behaviour manifested during undrained
        
        
          loading (refer to Figure 4), the virginAH soil appears to fully
        
        
          conform to the framework laid out by CS.


            0.5


            1.0


            1.5


            2.0


            2.5


            3.0


            3.5


            1


            10


            100


            1,000


            Critical State


            Undisturbed AH Soil


            Remoulded AH Soil


            Natural Soil Consolidation Line


            Remoulded Soil Consolidation Line


            Void Ratio: e


            Mean Effective Stress: p' 


          Figure 5.  Critical state and soil state of AH soil before undrained
        
        
          loading.
        
        
          11 SHANSEP PROCEDURE
        
        
          SHANSEP (Stress History and Normalized Soil Engineering
        
        
          Properties) was proposed by (Ladd and Foot 1974) as an
        
        
          empirical method to adopt in engineering practice to estimate
        
        
          the undrained shear strength on consideration of stress history
        
        
          effects arising from geological unloading.  The over-
        
        
          consolidation ratio (OCR =


          ’
        
        
          p
        
        
          /


          ’
        
        
          v
        
        
          ) is chosen as a parameter to
        
        
          encapsulate the stress history effects, with the OCR values
        
        
          determined by high quality oedometer data.  In mathematical
        
        
          terms, SHANSEP correlates the undrained shear strength with
        
        
          the soil OCR as follows:


            m


            OCR v


            u


            m


            v


            u


            OCR


            s


            OCR S s


          1
        
        
          '
        
        
          '


          (2)
        
        
          where: S = intercept with vertical axis at OCR = 1; and m =
        
        
          gradient of linear relationship.
        
        
          A plot of undrained shear strength ratio (s
        
        
          u
        
        
          /


          ’
        
        
          v
        
        
          ) with OCR
        
        
          based on CPTu data is shown inFigure 6. The CPTu data was
        
        
          found to manifest a linear response, with slope gradients within
        
        
          the bounds of linear relationships shown with dashed lines.  In
        
        
          the normally consolidation range, all linear relationships
        
        
          intersect the vertical axis at a constant (s
        
        
          u
        
        
          /


          ’
        
        
          v
        
        
          )
        
        
          OCR=1
        
        
          = 0.35.