2760
Proceedings of the 18
th
International Conference on Soil Mechanics and Geotechnical Engineering, Paris 2013
2
VISUALIZATION OF GROUND BEHAVIOR UNDER
PLANE STRAIN CONDITION
100mm
250mm
Height of model ground
H
= 270mm
Length of pile
H
1
=200mm
Vertical
load
Load cell
(
Pile head
)
Load cell
(
Pile end
)
Loading plate
Displacement
gauge
Pile
Box shaped cell
Drainage
port
Kaolin clay
Plan view
Side view
Pore pressure
transducer
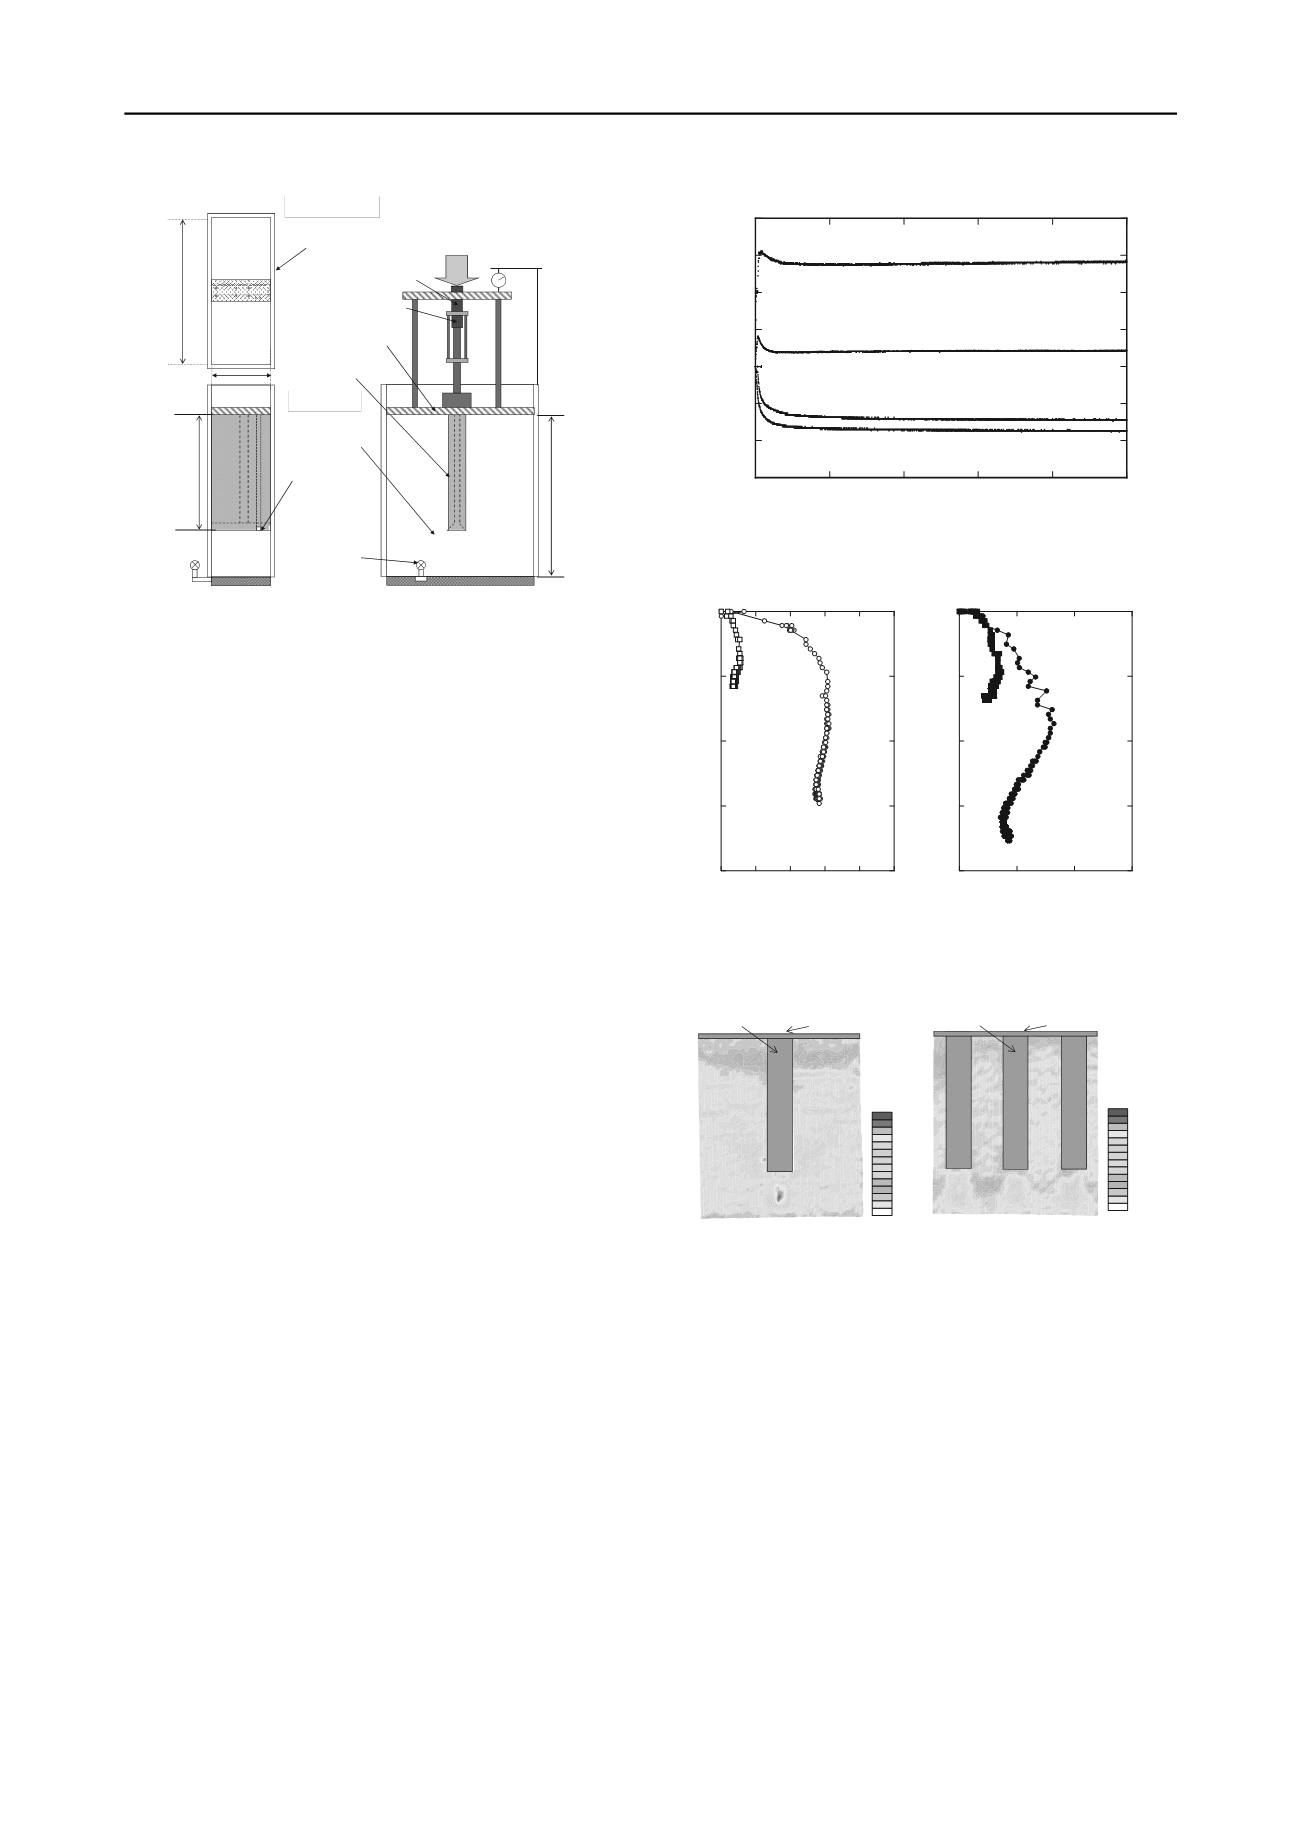
Figure 2. Loading model test under the plane strain condition
-0.3
-0.2
-0.1
0
0.1
0.2
0.3
0.4
0
100
200
300
400
500
Time
T
(min)
Δ
f
/
Δ
σ
S /D
1 pile
Δf
/
Δσ
(
σ
=20-40 (kPa) )
Δf
/
Δσ
(
σ
=40-80 (kPa) )
S
/
D
(
σ
=20-40 (kPa) )
S
/
D
(
σ
=40-80 (kPa) )
Figure 3. Relationships between skin friction and settlement
2.1
Outline of model test
Figure 2 shows the apparatus used in the model test under the
plane strain condition. The model tests were carried out with
drainage at the upper and lower surfaces. Wall friction was
reduced by a rubber membrane between the specimen and
acrylic plate. The tests for the model ground were conducted
under stress controlled conditions. The vertical load and
consolidation settlement were also measured. This apparatus
can also measure the pile head and end resistance individually at
the center of model pile (Ishikura et al., 2012).
The model ground was prepared by using Kaolin clay and
model pile. Kaolin clay was remolded in a slurry condition with
a water content of about 80%. This slurry was then poured into
the consolidation cell up to a depth of about 350mm. The
specimen was consolidated under a pre-consolidation pressure
of 20kPa using a bellofram cylinder until the end of primary
consolidation. After pre-consolidation, a model ground with a
height
H
of about 270mm was obtained.
0
0.05
0.10
0.15
0.20
0 0.1 0.2 0.3 0.4 0.5
Normalized settlement
S
/
D
Normalized skin friction
Δ
f/
Δ
σ
1pile
Δσ
=20kPa
(
σ
=20-40)
1pile
Δσ
=40kPa
(
σ
=40-80)
3piles
Δσ
=20kPa
(
σ
=20-40)
3piles
Δσ
=40kPa
(
σ
=40-80)
0
0.05
0.10
0.15
0.20
0
0.05
0.10
0.1
Normalized settlement
S
/
D
Normalized skin friction
Δ
f/
Δ
σ
5
Figure4. Relationships between normalized settlement and skin
friction
.
The model piles are composed of aluminum and have 30mm
in width
D
, 100mm in depth and 200mm in length
H
1
. Pore
pressure transducer was placed at the bottom of model pile.
After the model ground was prepared, consolidation pressure
was applied and increased stepwise from σ =20kPa to 40kPa,
40kPa to 80kPa using bellofram cylinder. The loads are applied
to unimproved ground and improved grounds with 1 or 3 piles.
2.2
Test results and discussions
Figure 3 shows the relationships between normalized settlement
S
/
D
, normalized incremental averaged skin friction
Δf
/
Δ
σ and
elapsed time in the consolidation process with 1 pile.
Incremental averaged skin friction
Δf
is the value that divides
the load difference between the pile head and pile end by the
surface area of the model pile. As shown in this figure,
normalized settlement
S
/
D
increased with elapsed time and
converged to the constant value. On the other hand, incremental
averaged skin friction
Δf
initially
increased just applying on the
vertical pressure, however, after reaching the peak incremental
skin friction
Δf
, these began to decrease with elapsed time and
later converged to the constant values.
Figure 4 shows the corresponding relationships between the
normalized settlement
S
/
D
and normalized averaged
incremental skin friction
Δf
/
Δ
σ
under several test conditions. It
is considered that averaged incremental skin friction
Δf
is
mobilized by acting relative displacement between the model
pile and soft clay around the pile end surface during
consolidation. As shown in this figure, normalized skin friction
and normalized settlement curves with 1 pile are different from
that with 3 piles under several consolidation pressures. However,
normalized averaged incremental skin friction
Δf
/
Δ
σ increased
initially with an increase of the normalized settlement and later
converged to the constant value under all the test conditions.
-25
-15
-5
5
15
25
35
45
(%)
Loading plate
Pile
1 pile (σ=0→80kPa)
-25
-15
-5
5
15
25
35
45
(%)
Loading plate
Pile
3 piles (σ=0→80kPa)
Figure5. Vertical strain distribution after consolidation
Figure 5 shows the vertical strain distributions with 1 pile and
3 piles. These strains can be obtained from the deformation
vectors during loading model tests. Deformation vectors are
obtained by observing the ground behaviors through the rubber
membrane. As shown in this figures, vertical strain of soft clay
just below the pile end increased significantly with 1 pile. It is
considered that the applied load is transferred from the model
pile to the soft clay. It is also observed that vertical strain of soft
clay just below the pile end with 3 piles is smaller than that with
1 pile. On the other hand, soft clay just below the loading plate
has little vertical strain in comparison with that of just below the
pile end in both test conditions.


