1961
Technical Committee 207 /
Comité technique 207
predictions (Damians et al. 2013). This value was adopted in the
current study.
3.1.2
Reinforcement loads
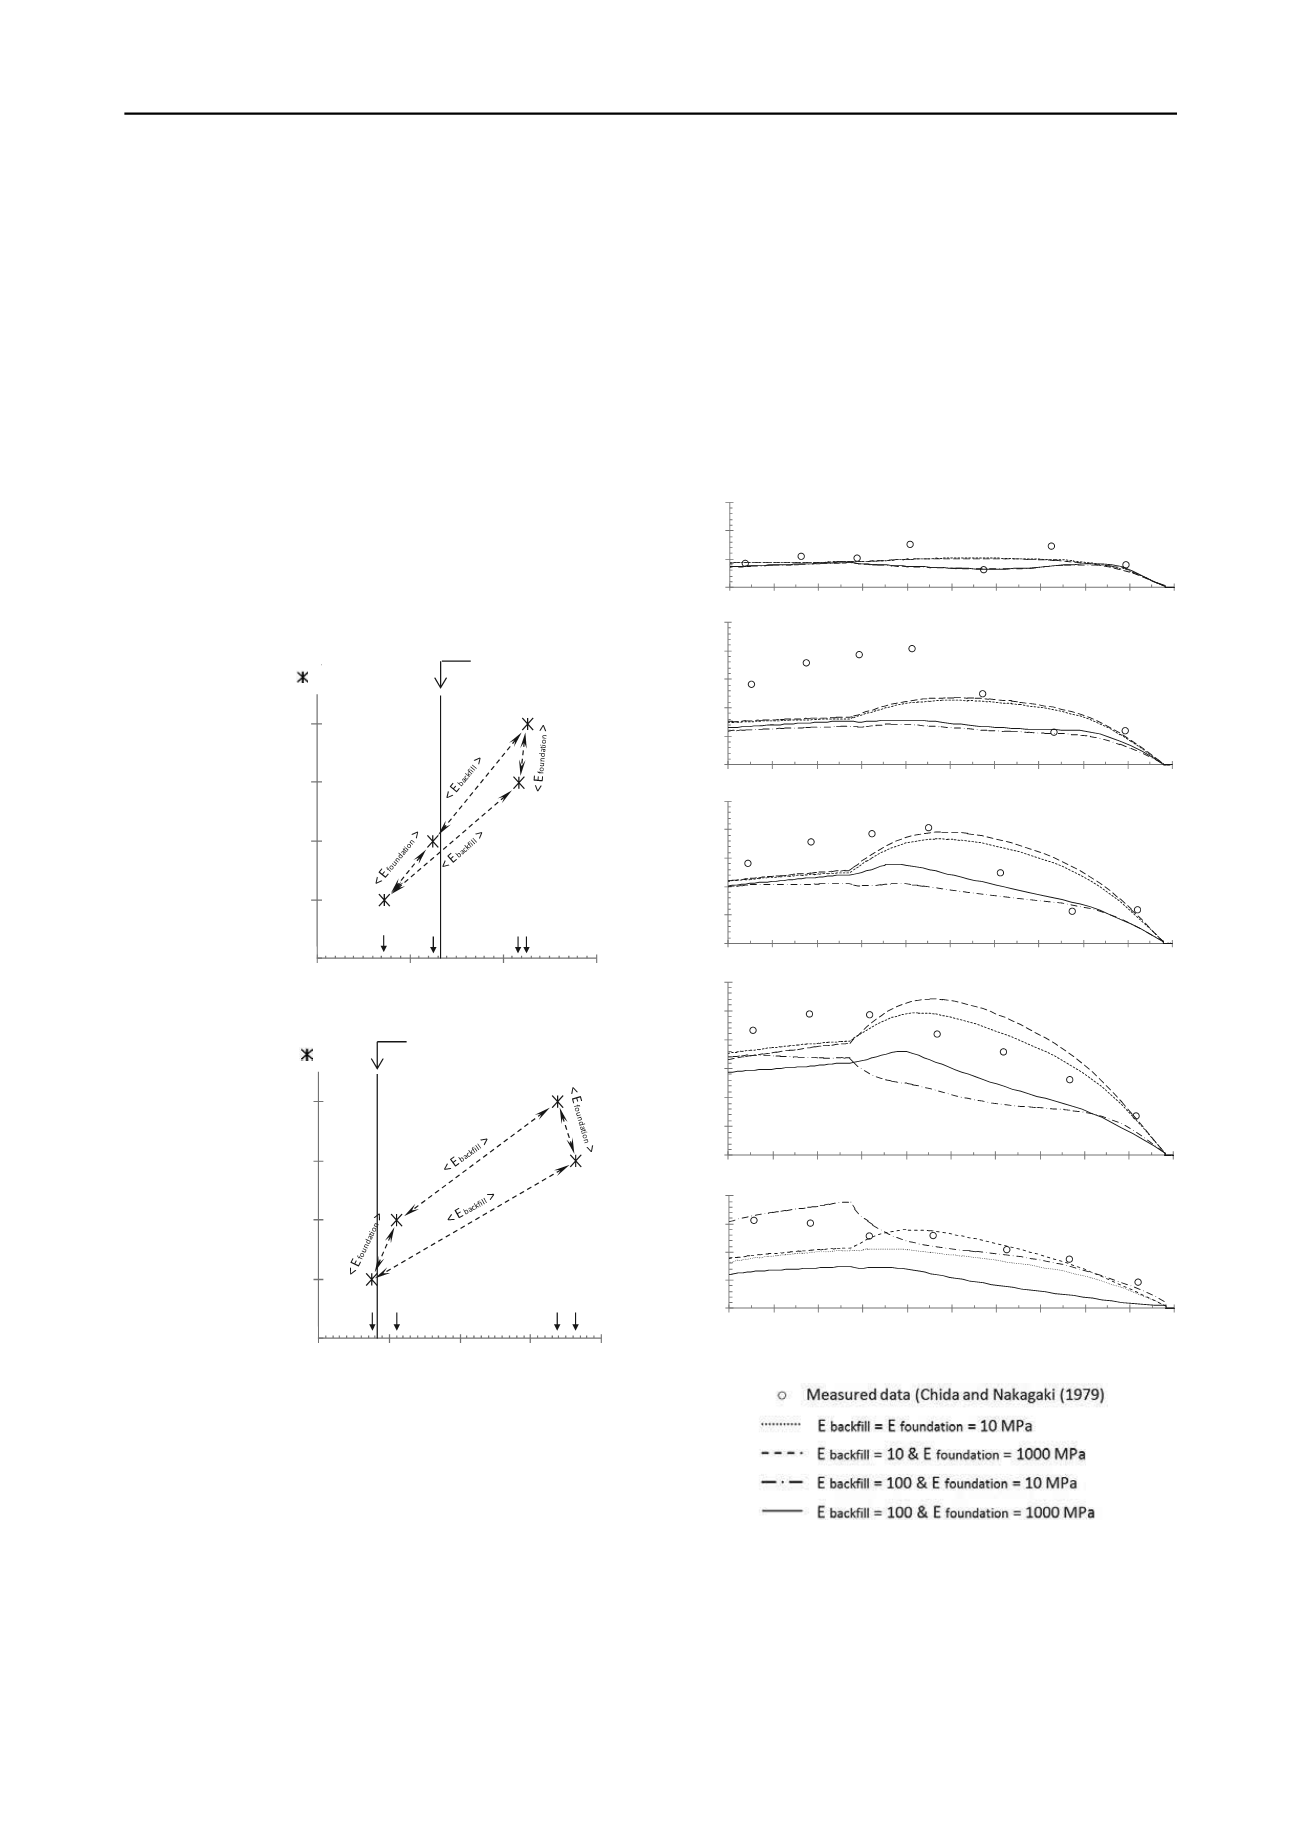
In Figure 3 are shown the results of the reinforcement tensile
loads obtained from numerical modelling and comparison with
measured data for selected strips at different elevations. The
reinforcement length considered in this study is 0.6 – 0.7 times
the total wall height. Steel strips with lengths from 4.0 to 5.0 m
were used in the reference case study, so all locations along any
reinforcement layer are normalized with the respect to the layer
length.
The presented results show good agreement between the
numerical model results and measured data. The backfill-
foundation stiffness combination results give different tensile-
load distributions in the reinforcement layers. The effect of the
less-compacted soil near the facing can be clearly detected with
the discontinuity at a normalized distance from 0 to 0.25.
a) R
i
= 0.3
b) R
i
= 0.6
Figure 2. Total vertical loads under the facing assuming soil-facing
interface reduction factor R
i
= 0.3 (a), and R
i
= 0.6 (b)
3.2
Influence of vertical facing stiffness
As noted earlier, the vertical facing stiffness was modified by
changing the number of horizontal joints along the facing height
of the wall. The reported case (base-case) had three horizontal
joins (four panels of 1.5 m-height). Three other cases were
considered to investigate the effect of the vertical facing
stiffness (see Figure 4).
Figure 5 shows the numerical model reinforcement tensile-
loads with respect to the number of horizontal joints. The values
correspond to the maximum load (T
maximum
) of all the
reinforcement strips, its related strip, and the normalized
distance of T
max
to the facing in the strip. Reported values
obtained from Chida and Nakagaki (1979) are also shown.
First, it can be noted that there is little difference in the
predicted T
max
value with respect to the backfill and foundation
stiffness combinations (less than 4 kN/m in the case with more
divergence, i.e. E
backfill
= 100 MPa and E
foundation
=10 MPa
combination). All the T
max
values (numerical and measured) are
located at the bottom zone of the wall (all at the layer located at
1.13 m, except the numerical case with E
backfill
= 100 MPa and
E
foundation
=10 MPa). With respect to their location in the
reinforcement (normalized distance from the facing), all the
T
max
values are located between 0.3 and 0.5.
0
5
10
15
0
0.1 0.2 0.3 0.4 0.5 0.6 0.7 0.8 0.9
1
0
5
10
15
20
25
0
0.1 0.2 0.3 0.4 0.5 0.6 0.7 0.8 0.9
1
0
5
10
15
20
25
0
0.1 0.2 0.3 0.4 0.5 0.6 0.7 0.8 0.9
1
0
5
10
15
20
25
30
0
0.1 0.2 0.3 0.4 0.5 0.6 0.7 0.8 0.9
Figure 3. Tensile-load distribution of the wall reinforcements at the end
of construction. (Normalized distance = distance to the facing of a stress
i-point / total length of the reinforcement)
0
1
2
3
4
5
40
50
60
70
Vertical facing load (kN/m)
E
backfill
=
10 MPa
&
E
foundation
=
10 MPa
E
backfill
=
10 MPa
&
E
foundation
=
1000 MPa
E
backfill
=
100 MPa
&
E
foundation
=
1000 MPa
E
backfill
=
100 MPa
&
E
foundation
=
10 MPa
Measuredvalue
(Chida & Nakagaki 1979)
Numerical‐model cases
( )
0
1
2
3
4
5
45
55
65
75
85
Vertical facing load (kN/m)
E
backfill
=
10 MPa
&
E
foundation
=
10 MPa
E
backfill
=
10 MPa
&
E
foundation
=
1000 MPa
E
backfill
= 100 MPa
&
E
foundation
=
1000 MPa
E
backfill
=
100 MPa
&
E
foundation
=
10 MPa
Measuredvalue
(Chida & Nakagaki 1979)
Numerical‐model cases
( )
1
0
5
10
15
20
0
0.1 0.2 0.3 0.4 0.5 0.6 0.7 0.8 0.9
Normalized distance to the facing
1
Reinforcement tensile loads (kN/m)
Strip location:
h = 4.94 m (layer 7)
h = 3.42 m (layer 5)
h = 1.9 m (layer 3)
h = 1.13 m (layer 2)
h = 0.38 m (layer 1)


