1438
Proceedings of the 18
th
International Conference on Soil Mechanics and Geotechnical Engineering, Paris 2013
cm (
t
i
: sedimentation period in Phase
i
). During Phases 2 - 5,
the sedimentation factor may have increased to
s
v
2 10
-3
m
2
/s
based on a subsequent sedimentation period reduction from 0.8
to 0.6 seconds. For Phase 6, with a heavier bullet, not more than
the top
h
= (
s
v
t
8
)
0.5
4.5 cm liquefied in the following 9 phases,
not reaching position WM1. It should be noted that the
sedimentation or self-weight hindered dispersion behaves non-
linearly due to the growing inter-particle effect (see e.g. the
decreasing trend of recorded excess pore pressures at WM2,
during Phases 2 - 5 and Phases 6 - 14, in Table 1). During Phase
15 to 17, with a heavy swing, almost all the loose sand liquefied
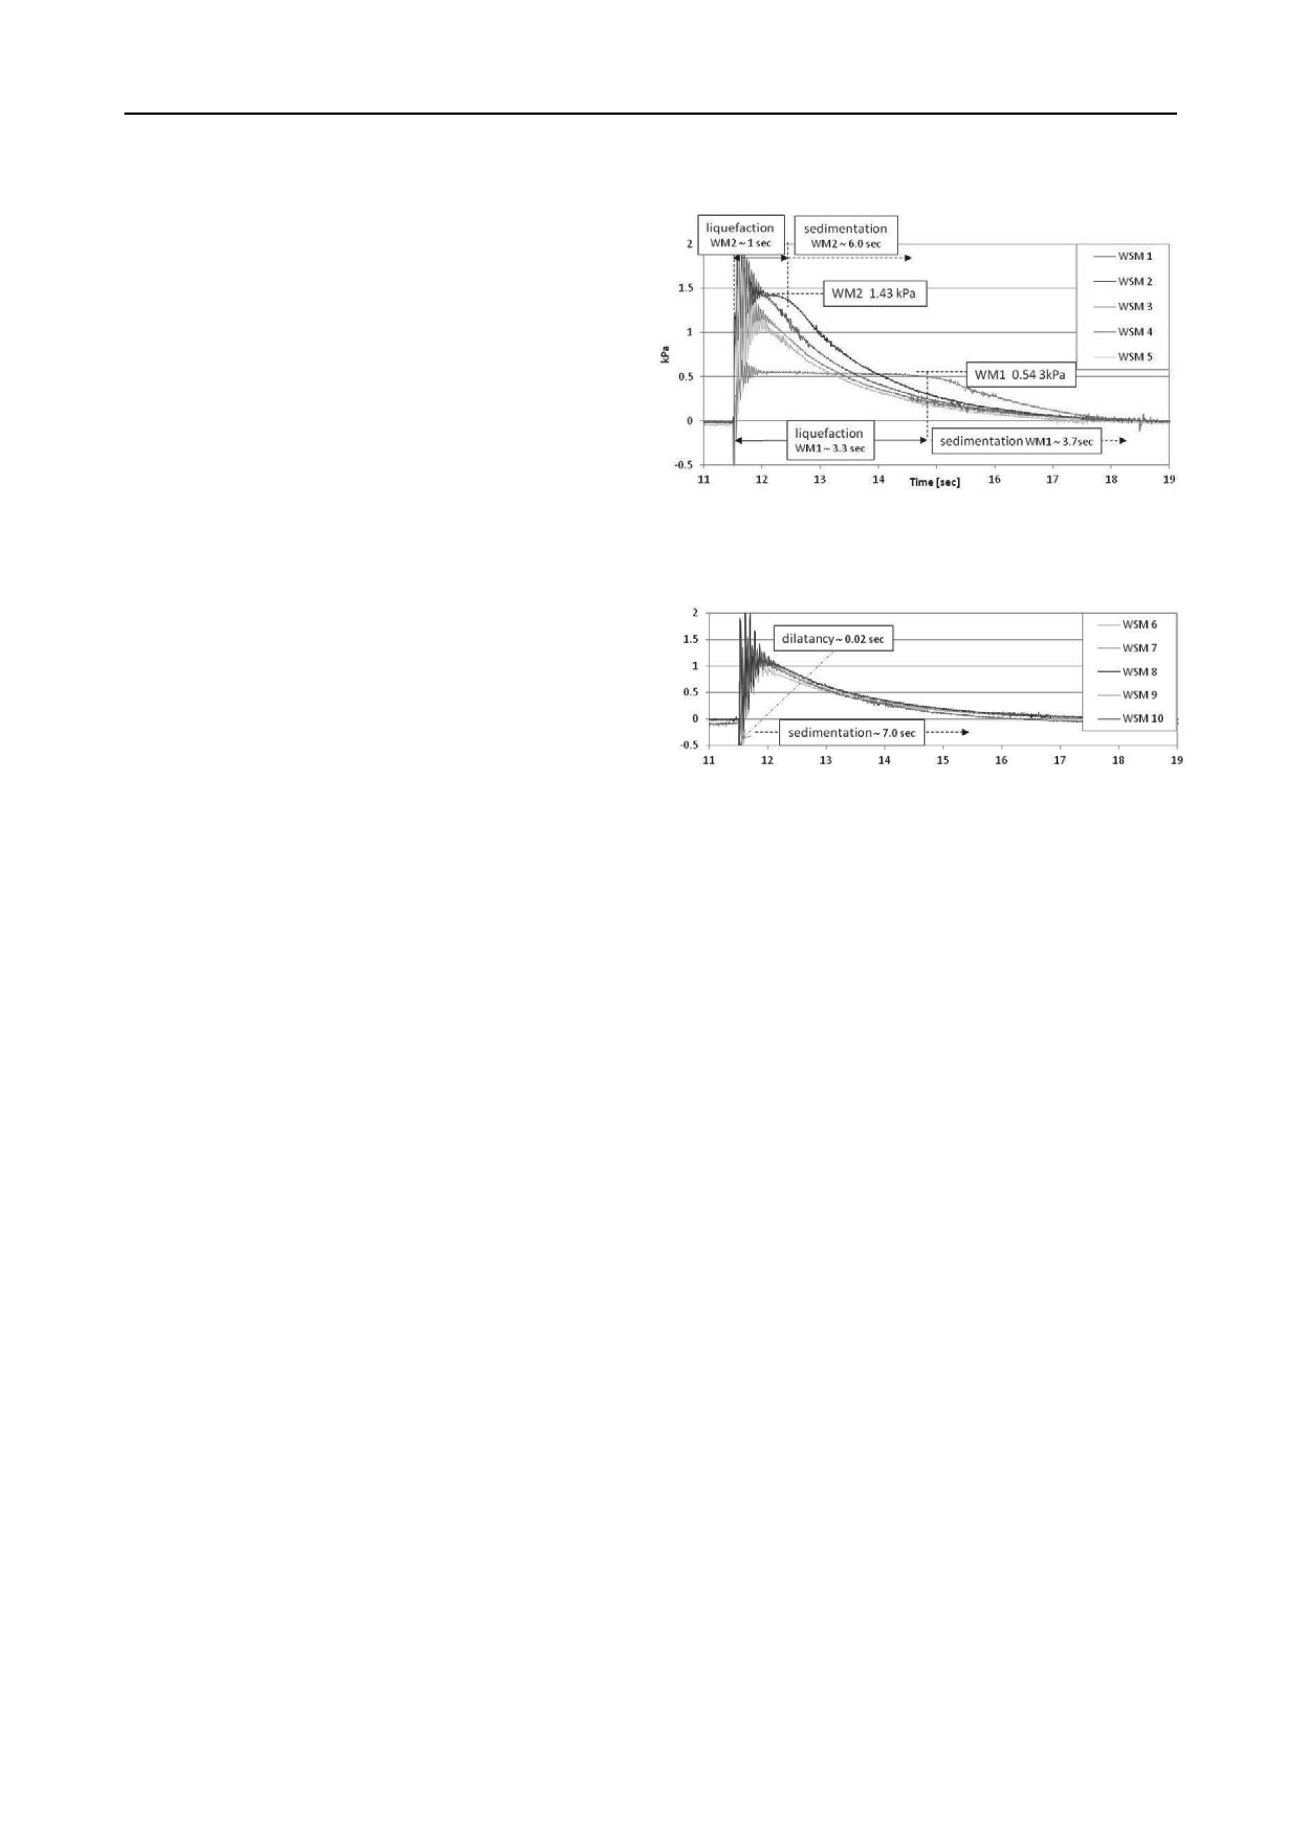
noticed by periods of constant excess pressures in WM1 (~0.55
kPa) and WM2 (1.43 kPa), shown in Figure 7a.
2.3.3
Phase 20, the 75 cm trigger swing
Figure 7a. Excess pore pressures WM1 to WM5 during Phase 20
Most interesting test is Phase 20. Under the heaviest swing
impact, this phase showed full liquefaction of the loose sand
volume reaching under WM2, see Figure 7a. The recorded
excess pore pressures of WM1 and WM2 during liquefaction
reveal a density gradient of (1.430– 0.543)/0.094 = 0.9436. The
average mud weight of the liquefied sand is therefore 19.436
kN/m
3
. Being equal to (1-
n
)
s
+
n
w
= 19.436, it leads to
n
20
=
0.41 or a relative density of
I
D
= 0.511. These values have been
taken to calibrate the densities of all other tests, as shown in
Table 1. The method using the sand surface settlement (Figure
5e) appeared less accurate. The vibrations in the beginning of
every record are due to the system frequency, about 25 Hz.
They vanish rapidly, within 0.5 seconds. It should be noted that
most of the loose sand volume liquefied during Phase 15 to 21,
whereas lighter triggers used beforehand during Phase 1 to 14
did only liquefy just the top part above WM1.
Figure 7b. Excess pore pressures WM6 to WM10 during Phase 20
4 ACKNOWLEDGEMENT
In the very early stage (during each Phase), dilatancy caused
negative pore pressure almost everywhere in densely packed
sand during a rather short period (less than 0.02 seconds). In
Phase 20, the sedimentation period after liquefaction took about
7 seconds, and everywhere, both in the loose and in the dense
sand significant excess pore pressures were observed during this
sedimentation period. Phase 21, which revealed similar effects
as Phase 20, can be viewed as an act of a quake, a 10 cm sudden
drop of the entire tub. This implies that quite some energy is
required to really liquefy loose sand deposits. However, if
liquefaction occurs the sedimentation process of the liquefied
mud induces significant excess pore pressures reaching far aside
and underneath the liquefied zone for as long as the
sedimentation process takes.
Kind acknowledgement is mentioned for the mud sedimentation
test commissioned by GasUnie in 2007, for the 1D liquefaction
test freely commissioned by Deltares in 2011, and for the 3D
liquefaction test made available by research funding from
Rijkswaterstaat in 2012. The cooperation of the expert group of
Deltares GeoLab is cordially appreciated.
5 REFERENCES
Barends, F.B.J. & Ruygrok, P. 1997. The cyclic liquefaction potential of
a submerged cohesionless sand bed: a practical method.
Proc
BOSS'97, Elsevier Science Ltd
(1),71-84.
de Groot, M.B., Bolton, M.D., Foray, P., Meijers, P., Palmer, A.C.,
Sandven, R., Sawicki, A. & Teh, T.C. 2006. Physics of liquefaction
phenomena around marine structures.
ASCE Journal of Waterway,
Port, Coastal and Ocean Engineering
, 132: 227-243.
Lindenberg, J. & Koning, H.L. 1981. Critical density of sand.
Géotechnique
31 (2) 231-245.
3 CONCLUSIONS
The intensity of a liquefaction trigger and the extent of induced
excess pore water pressures when partly liquefaction occurs are
investigated by 1D and 3D tests. Hardly any liquefaction
happens when the trigger intensity is small. However, if
liquefaction occurs, significant excess pore pressures will arise
also in the non-liquefied surroundings and they diminish slowly
during the sedimentation period, affecting metastability regions
(Stoutjesdijk e.a. 1998). The related densification itself, the
porosity decrease, is yet quite small, so that the probability of a
new liquefaction remains. In conclusion, if the likelihood of an
intensive trigger is small and liquefied zone limited, rigorous
measures at great expenses are not required to guarantee e.g.
stability of buildings and dikes. However, in case a trigger may
be intense and liquefaction zone is not small, its destructive
impact can be far reaching particularly due to the related excess
pore pressures in a much wider area. It is suggested to translate
these findings to site situations and formulate proper guide
lines.
Ishihara, K. 1993. Liquefaction and flow failure during earthquakes.
Géotechnique
43 (3) 351 –451
Pane, V. & Schiffman, R.L. 1985. A note on sedimentation and
consolidation.
Géotechnique
35 (1) 69-72.
Poulos, S.J. 1971. The steady state of deformation.
Geot Eng. Div.
IASCE
107 (GT5) 553-562.
Stoutjesdijk, T.P., de Groot, M.B. & Lindenberg, J. 1998. Flow slide
prediction method: influence on slope geometry.
Can. Geotechn. Jl.
35 (1) 43-54


