1442
Proceedings of the 18
th
International Conference on Soil Mechanics and Geotechnical Engineering, Paris 2013
290 300 310 320 330 340 350 360 370 380 390 400 410 420 430 440
No. of cycles
0
1
2
3
4
5
s
0
2
4
6
8
10
v
(%)
290 300 310 320 330 340 350 360 370 380 390 400 410 420 430 440
R
max
=4.71
R
max
=5.25
(%)
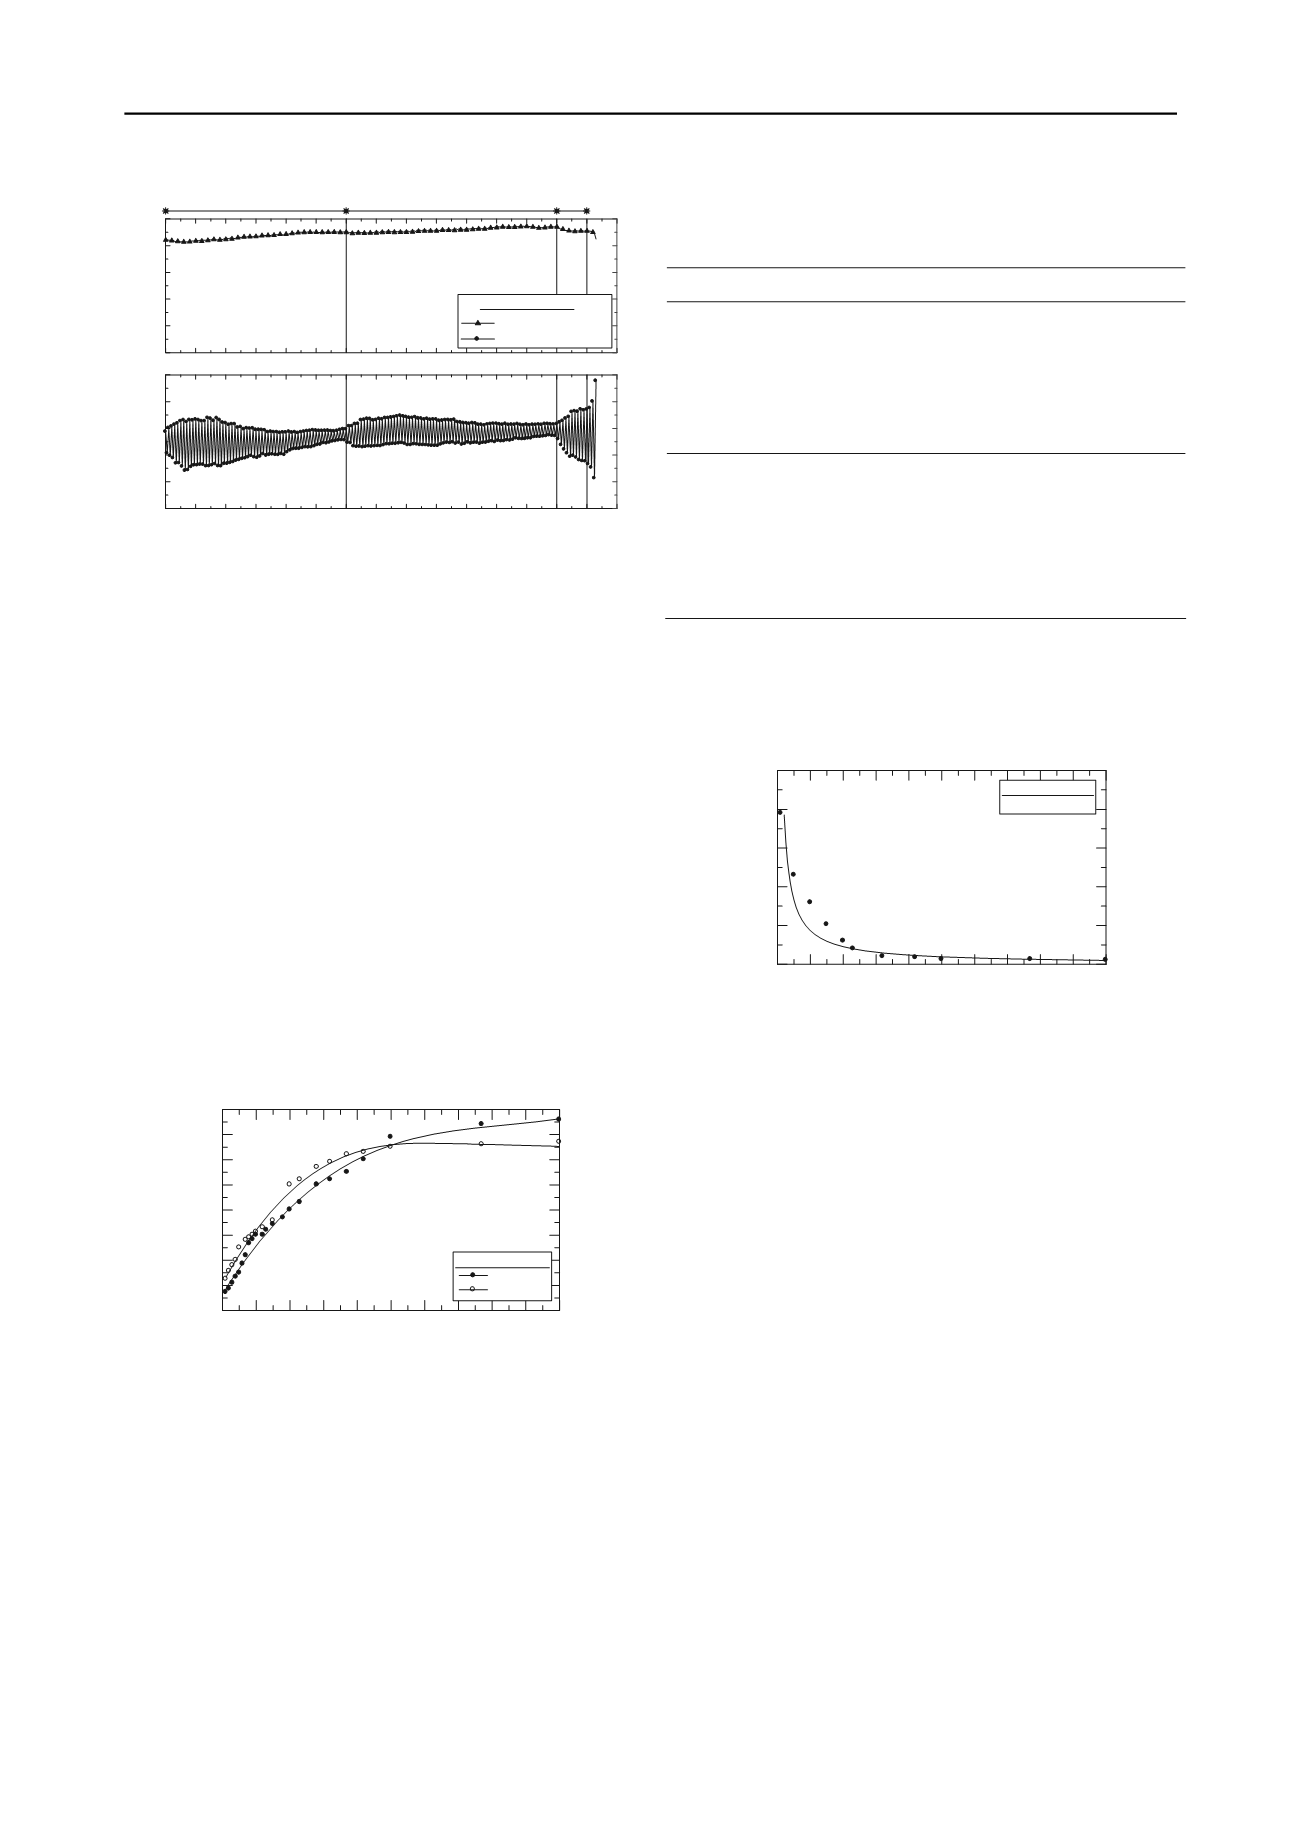
(d)
Test no. : L-433
Volumetric strain
Shear strain
R
max
=5.061
Figure 5. (Continued)
The initial peak stress ratio for the loose sand, Figure 5, started
at t/s=0.40 (R
max
=2.33) in order to prevent premature failure
prior to densification. When sans attains a form of elastic
behavior, R
max
was again increased. It is clear that even at high
stress ratio (R
max
=5.061), the sand tends to reach a steady state.
6.4 Evaluation of shear modulus and damping ratio
Most experimental investigations have implied that the shear
modulus-shear strain relations are mainly affected by voids ratio
and mean confining stress (e.g. Alarcon-Guzman et al, 1989).
Sand under cyclic stressing exhibits non-linear hysteretic stress-
strain behavior. The equivalent linear shear modulus, G, can be
defined by the slope of the chord passing through the ends of
hysteresis loop. As mentioned earlier after many cycles the open
stress-strain hysteresis loop transforms almost into a unique line
during reloading and unloading (Figures 4 and 5). It is evident
with increasing number of cycles the hysteresis loop of stress-
strain becomes gradually narrower and the line whose slope
shows the equivalent shear modulus cannot be separated from a
single stress-strain path during unloading and reloading. This
implies that the sand essentially behaves elastically.
0 10 20 30 40 50 60 70 80 90 100
No. of cycles
0
10
20
30
40
50
60
70
80
Shear modulus (GPa)
Test No.: D-290
R =4
R =4.33
max
max
Figure 6. Variation of shear modulus with number of cycles
Shown in Figure 6 are the variations of shear modulus with
number of cycles. It is clear that after many cycles the
magnitude of shear modulus tends to remain constant, implying
an elastic behavior. The following table summarizes the
magnitudes of shear modulus as evaluated after several cycles at
each of eight different stress ratios. The derived magnitudes of
shear modulus for dense test, indicate that for all stress ratios
below R
max
=5.15 the sand attains a form of elastic deformation
as the number of cycles approaches 50. An average magnitude
of G=70 MPa for all stress levels below R=5.15 implies that if
sand behaves elastically at any maximum principal stress ratio,
R
max
5.15, then there exists a unique value for shear modulus
which is independent from the stress level and current voids
ratio. However, when the maximum stress ratio is as high as
R
max
=5.67, the magnitude of G=32.9 MPa, is considerable lower
than the average magnitude, G=70 MPa, obtained earlier.
Table 2. Evaluation of shear modulus for dense and loose sand at
several peak stress ratios.
Test Number
R
max
No of cycle
G (GPa)
D-290
4.00
4.33
4.71
5.15
5.67
6.27
7.00
50
100
150
200
250
270
275
75.8
67.8
69.3
71.2
32.9
4.53
4.52
L-433
2.33
3.00
3.44
3.71
4.00
4.33
4.71
5.06
100
124
149
189
229
289
349
419
45.2
38.7
20.0
35.2
30.8
28.8
36.7
34.7
The damping ratio for dense test is shown in Figure 7. The
damping ratio decreases with increasing number of cycles. After
a large number of cycles, damping ratio tends to becomes zero,
again indicating an elastic behavior.
0 10 20 30 40 50 60 70 80 90 100
No. of cycles
0
10
20
30
40
50
Damping ratio (%)
Test No.: D-290
R = 4
max
Figure 7. Variation of shear modulus with number of cycles..
7 CONCLUSIONS
The following points have been raised in this research:
When sand is subjected to cyclic stressing between two equal
peak stress ratios, the sand particles arrange themselves to resist
the directional loading.
Ideally true elastic response can only be achieved when the soil
reaches its densest possible state. However, a strong induced
structure may give the same shear modulus even though the soil
is not at densest state.
There is a unique stress ratio below which cyclic stressing
causes sand to attain an elastic state and above it cyclic stressing
results in a softening response which eventually leads to a
run
away
failure.
8 REFERENCES
Abdul Lahil B. M., Cheung Robert S. L., Mizanur M. R. 2010. Cyclic
instability behavior of sand-silt mixture under partial cyclic reversal
loading,
Recent Advances in Geotechnical Earthquake and Soil
dynamics Symposium
, San Diego, California.
Alarcon-Guzman A., Chameau J. L., Leonards G.A., Frost J. D., 1989.
Shear modulus and cyclic undrained behaviour of sands
,
Soils and
Foundations
, Vol. 29, No. 4, pp. 105-119
Huang Y., Huang A., Kuo Y. C. and Tsai M. 2004. A laboratory study
on the undrained strength of a silty sand from Central Western
Taiwan,
Soil Dynamics and Earthquake Engineering
24, 733-743.
Sitharam T. G., Govinda Raju L., Srinivasa Murthy B.R. 2004. Cyclic
and monotonic undrained shear response of silty sand from bhuj
region in india,
ISET Journal of Earthquake Technology, Vol. 41,
No. 2-4, pp. 249-260
Springman, S. & Norrish, A., (1995), "
Integral bridges - Researches'
viewpoint
", The University of Cambridge.


