1440
Proceedings of the 18
th
International Conference on Soil Mechanics and Geotechnical Engineering, Paris 2013
increasing
x
and decreasing
y
whilst the mean biaxial stress,
(
x
+
y
)/2, was held constant at 50 kPa through the test. Typical
stress path for this kind of test are shown in Figure 1.
5 GENERAL EXPERIMENTAL PROCEDURE
Cyclic stress-controlled tests reported in the present research,
performed on dense and loose sand. Fluctuating stresses,
varying between principal stress ratios R
1max
=
x
/
y
and
R
2max
=
y
/
x
(where R
1max
=R
2max
), were imposed on sand
samples until a repeating state of strain was achieved and no
further significant volumetric change was observed (Tests
NDS50-1 and NLS50-2). The peak stress ratios were then
increased and the cyclic stressing repeated. This procedure was
repeated several times. The tests were terminated when the
imposition of a higher stress ratio caused the sand to exhibit
softening behavior which eventually led to a
run away
failure.
Table 1 summarizes the test conditions and program.
0
50
100
x
0
50
100
y
(kPa)
B
D
A
C
Commencing the test
Initial monotonic loading
Start of the first cycle
End of the first cycle
R
2max
y
x
x
y
R
1max
x
y
= =50 kPa
y
y
x
x
Depositon direction
z
z
, =0
(kPa)
=R
2max
R
1max
Figure 1. Stress path for cyclic stress controlled tests
6 TEST RESULTS
Following sections describe the behavior of loose and dense
sand including stress strain characteristics, volume change
trends, stiffening phenomenon and shear modulus evaluation.
Table 1. Test numbers and initial conditions of the cyclic tests; 90
hanges of principal stress direction.
c
Test Number
e
0
No of total cycles Principal stress ratio R
max
(Number of cycles)
D-290
0.52
290
4.00 (50)
4.33 (50)
4.71 (50)
5.15 (50)
5.67 (50)
6.27 (30)
7.00 (10)
L-433
0.72
433
2.33 (100)
3.00 (25)
3.44 (25)
3.71 (40)
4.00 (40)
4.33 (60)
4.71 (60)
5.06 (70)
5.25 (10)
5.45 (3)
1
The bracket indicates the number of cycles performed at a given stress ratio R
max
where R
max
is the maximum stress ratio during each stage of the tes
6.1 Stress strain behavior
In the course of cyclic stress loading during the first few cycles,
sand exhibits significant plastic deformation accompanied by
open hysteresis loops. Subsequent cycles give less plastic strain
and the loops appear nearly closed, implying the development
of a repeating state.
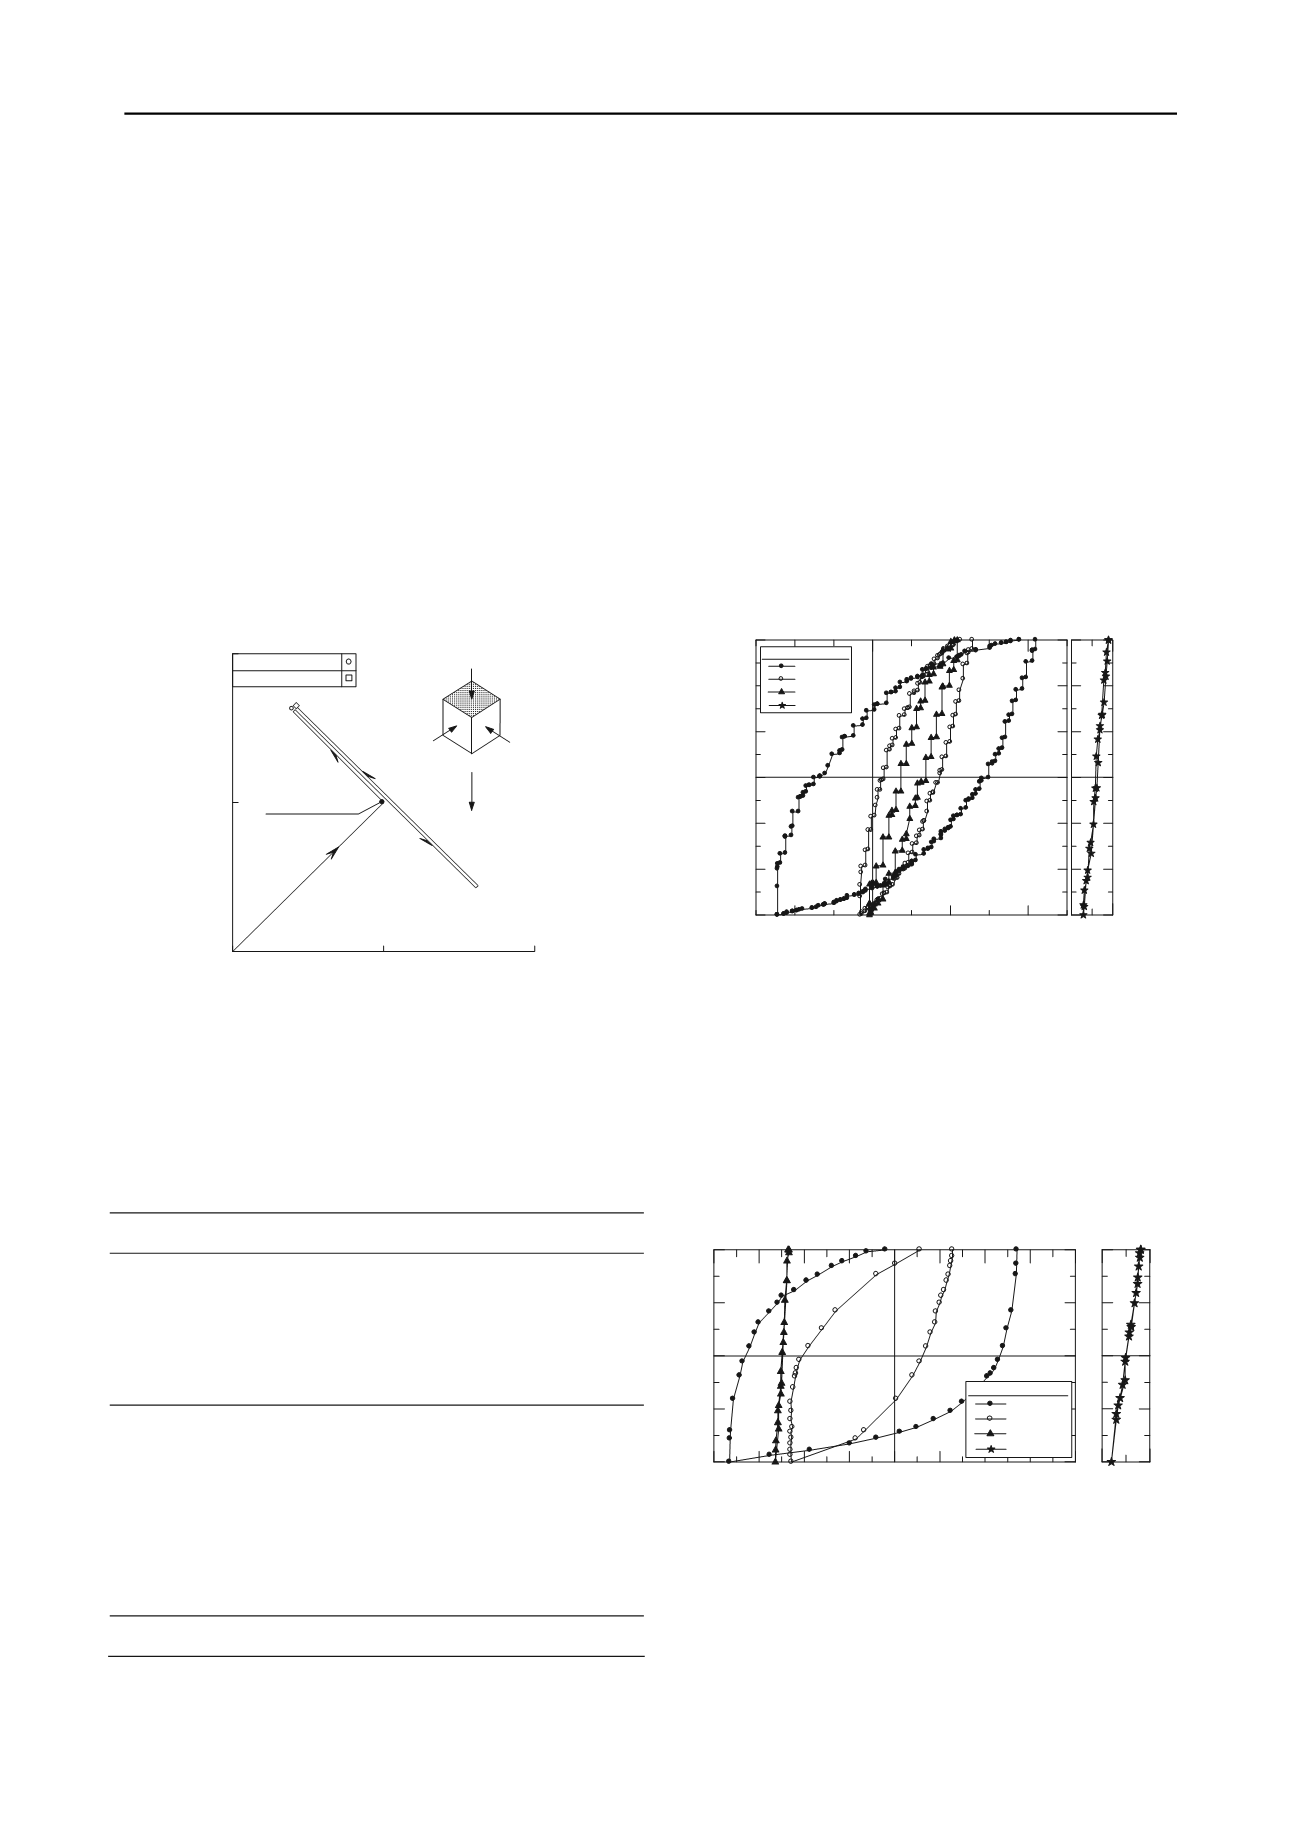
Dense Sand
: Figure 2 illustrates the hysteresis loops for dense
sand (for cycles 1, 5, 10, 15, and 50) in which the sand sample
was subject to cyclic stressing at different maximum principal
stress ratios from R
max
=4 to R
max
=7. It is worth mentioning that
the test results are shown only for R
max
=4. The Figure shows
that during the first few cycles the hysteresis loops are
open
and
after about 15 cycles the loops appear nearly closed. Further
cyclic stressing led to a progressive stiffening of the material
and resulted in apparent
elastic
behavior in which stress-strain
curves follow the same path during unloading and reloading, i.e.
the area within the hysteresis loop which represents the amount
of dissipated energy during a cycle tends to zero.
-0.5
0
0.5
1
s
-0.6
-0.4
-0.2
0
0.2
0.4
0.6
(Shear strain)%
x
y
x
y
0 0.25
s
t/s=
Test no. : N-290
Cycle 1
Cycle 5
Cycle 10
Cycle 50
Figure 2. Hysteresis loops for dense sand (test No. N-290)
Loose Sand
: The hysteresis loops for loose sand (Test L-430)
in which the principal stress ratio, R
max
varies between 2.33 and
5.45 are shown in Figure 3. The first cycle, in comparison with
10
th
cycle, produced a large hysteresis loop and a huge amount
of unrecoverable strain. Again, repeated cyclic stressing caused
sand to attain an elastic stress-strain response during unloading
and reloading. It is clear that after certain of cycles, say e.g. 20,
further cyclic stressing has no significant influence on the
elastic behavior of material, i.e. no change in shear modulus
will be observed.
-2 -1.5 -1 -0.5 0 0.5 1 1.5 2
s
-0.4
-0.2
0
0.2
0.4
(Shear strain)%
x
y
x
y
-1.5 -1.3
s
t/s=
Test no. : L-430
Cycle 1
Cycle 10
Cycle 50
Cycle 100
Figure 3. Hysteresis loops for Loose sand (test No. L-430)
6.2 Overall Volume Change Behavior
When dense or loose sand samples are subjected to cyclic
stressing at constant stress ratio amplitude, irrecoverable or
plastic strain during each successive cycle tends to reduce with
increasing number of cycles until the induced shear strain over a
cycle remains roughly constant, implying that elastic response
dominates. However, the magnitudes of volume change after
100 cycles are considerably different for the dense and loose


