1432
Proceedings of the 18
th
International Conference on Soil Mechanics and Geotechnical Engineering, Paris 2013
The information available is not enough to establish design
spectra or zoning for design in engineering.
2
GEOTECHNICAL CHARACTERIZATION
The reference Poder Ejecutivo Nacional 1989 collects the
geological information of the study area which is basically of
Holocene age.
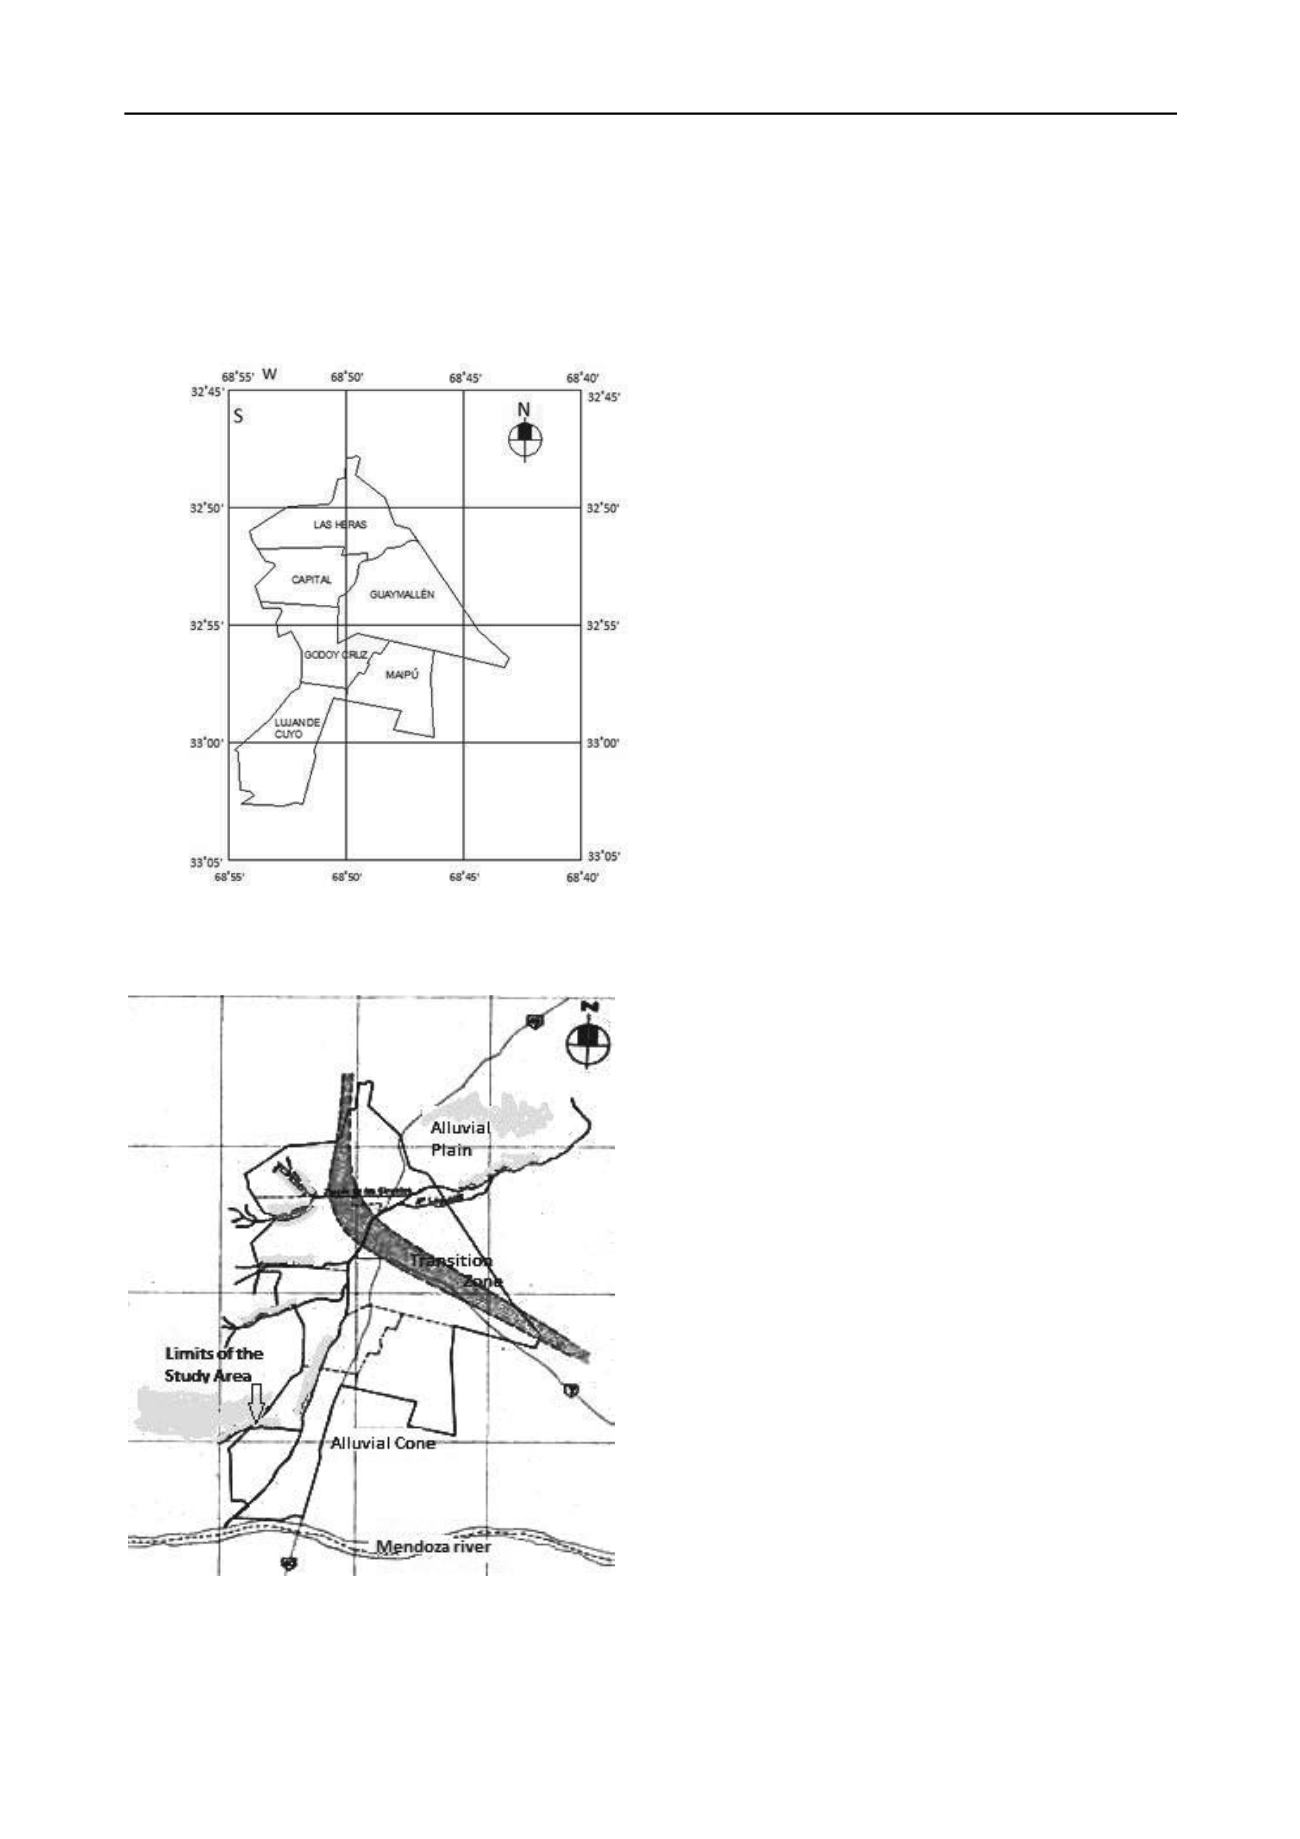
Figure 2: Municipalities in Mendoza city and surroundings
As Figure 3 illustrates three big deposits zones are
distinguished: the alluvial cone, alluvial plain and an area of
transition between the cone and the alluvial plain.
Figure 3: Distribution of superficial alluvial deposits in the study area
The maximum grain size of the sediments decreases from
the entrance of the alluvial fan close to the Mendoza River in
dir
d in Poder Ejecutivo Nacional 1989) and soils studies
fo
ies profiles were assessed through
em
ce
be
ing into account the characteristics of the materials.
Barchiesi & Mancipe 2012 describes the abovementioned
entioned. In this sensitivity analysis, the DEEP SOIL
no
1985 event, see Bardet et al 2000; ii) a signal
ob
each signal has associated a spectrum with
its
ent linear regime. In fine soils, the
programs in nonlinear regime displace maximum responses
toward the high periods.
ection to the NE of the alluvial plain where there are deep
fine deposits.
Seventy two geotechnical profiles were modeled in the
study. Information not available directly from measurements of
unitary weight was obtained through extrapolation equations
taking as a basis the information provided by selected profiles
(include
r foundations validated as reliable (gathered by Barchiesi
2009).
The above information was grouped by related areas and soil
type.
Shear wave velocit
pirical correlation equations based on N-values of standard
penetration tests (SPT).
These equations were selected through a process of
comparison whose indicator (
D
Vel [%]) was the differen
tween the values that yield correlation equations (theoretical)
and those measured in some profiles, divided by the last one.
Curves of stiffness degradation and damping increase with
shear deformation for different soils were taken from the
literature tak
procedure.
3
SENSIBILITY STUDIES
A sensitivity study to parameters with greater uncertainty that
are shear wave velocities and the type of soil as well as its
rigidity and damping curves, was performed. The first
parameter cited was obtained from correlations with known
information and the second was obtained from geotechnical
profiles and technical literature. An analysis was also performed
to study the influence of the characteristics of the signal input
and the type of software used. A synthetic signal obtained from
the INPRES 1991 spectrum for soil type 1 and seismic zone 4
was used in the study of sensitivity per signal type. The
envelope for this signal was established by similarity with those
observed in Mendoza in 1985 and 2006 events. The synthetic
signal was obtained from the spectrum by SIMQKE, Gasparini
& Vanmarcke 1976. This signal is scaled 0.35g corresponding
to the acceleration for null period of the spectrum of the cited
regulation (INPRES 1991) for the area and soil type
abovem
nlinear regime software was applied, see Youssef & Hashash
2011b.
On the other hand a sensitivity study was conducted to
evaluate the influence of the type of signal. In this study were
considered, in addition to the abovementioned synthetic signal,
the following ones: i) a signal corresponding to the study area
registered in thick, dense and outcroppings gravels in the Maipú
station during the
tained in rock in the 1994 Northridge earthquake, see Youssef
Hashash 2011a.
In this analysis it was observed that the spectrum
corresponding to the abovementioned regulations acts as an
envelope for the others (i) and ii)) also mentioned, proving
sufficient information to establish maximum seismic loads. That
is true even though
own characteristics in terms of maximum acceleration and
amplifier periods.
Computer programs used in the sensitivity analysis by
software are: SHAKE91 (Schnabel et al 1992) and EERA
(Bardet et al 2000) both linear equivalent, DEEP SOIL (Youssef
Hashash 2011b) and NERA (Bardet and Tobita 2001) (non-
linear). This analysis showed that in coarse soils, spectral
shapes and their periods of maximum amplification are similar
for all programs, except for the highest values of acceleration
for programs in equival


