1433
Technical Committee 203 /
Comité technique 203
Additionally, nonlinear computer programs evidenced great
degradation rigidity level associated to significant reductions in
maximum spectral accelerations.
In order to evaluate the possible effects of the quality of the
curves assumed for the degradation of stiffness (G/G
0
vs.
) and
the development of damping (D/D
0
vs.
) sensitivity analysis
against the first of these parameters were made, adopting greater
and lower values than those corresponding to the best possible
estimate.
The obtained results show predictable trends and a relatively
small influence of these parameters while they choose within
reasonable ranges.
Furthermore, rigidity curves lower than best estimates cause
greater G modulus degradation, evidenced by lower maximum
spectral accelerations and greater associated periods.
On the other hand was observed that in profiles with
predominance of coarse soils, if considering an increase in its
shear wave velocity with respect to the assumed values, then the
spectral amplification diminishes and as an extreme, the spectral
form in rock practically is preserved; and inversely if lower
stiffness than those assumed according to the best possible
estimate, are proposed.
In profiles with predominance of fine soil in the presence of
increases in shear wave velocities with respect to the adopted
values, spectra move towards high frequencies without
increases in spectral acceleration amplifications.
In the presence of diminishing in shear wave velocities was
verified the inverse phenomenon and strong reduction in
acceleration amplifications associated with larger deformations
and damping.
4
ZONATION
Owing to not enough shear wave measurements and
geotechnical information directly obtained are available and to
the fact that the quantity of available seismic events registers for
the study area is small, was not possible to establish design
spectra or to generate a seismic micro zoning applied to
engineering design.
Because of those reasons the seismic zoning proposed here
has a preliminary and advisory character being aimed to future
studies that look deeply into the theme.
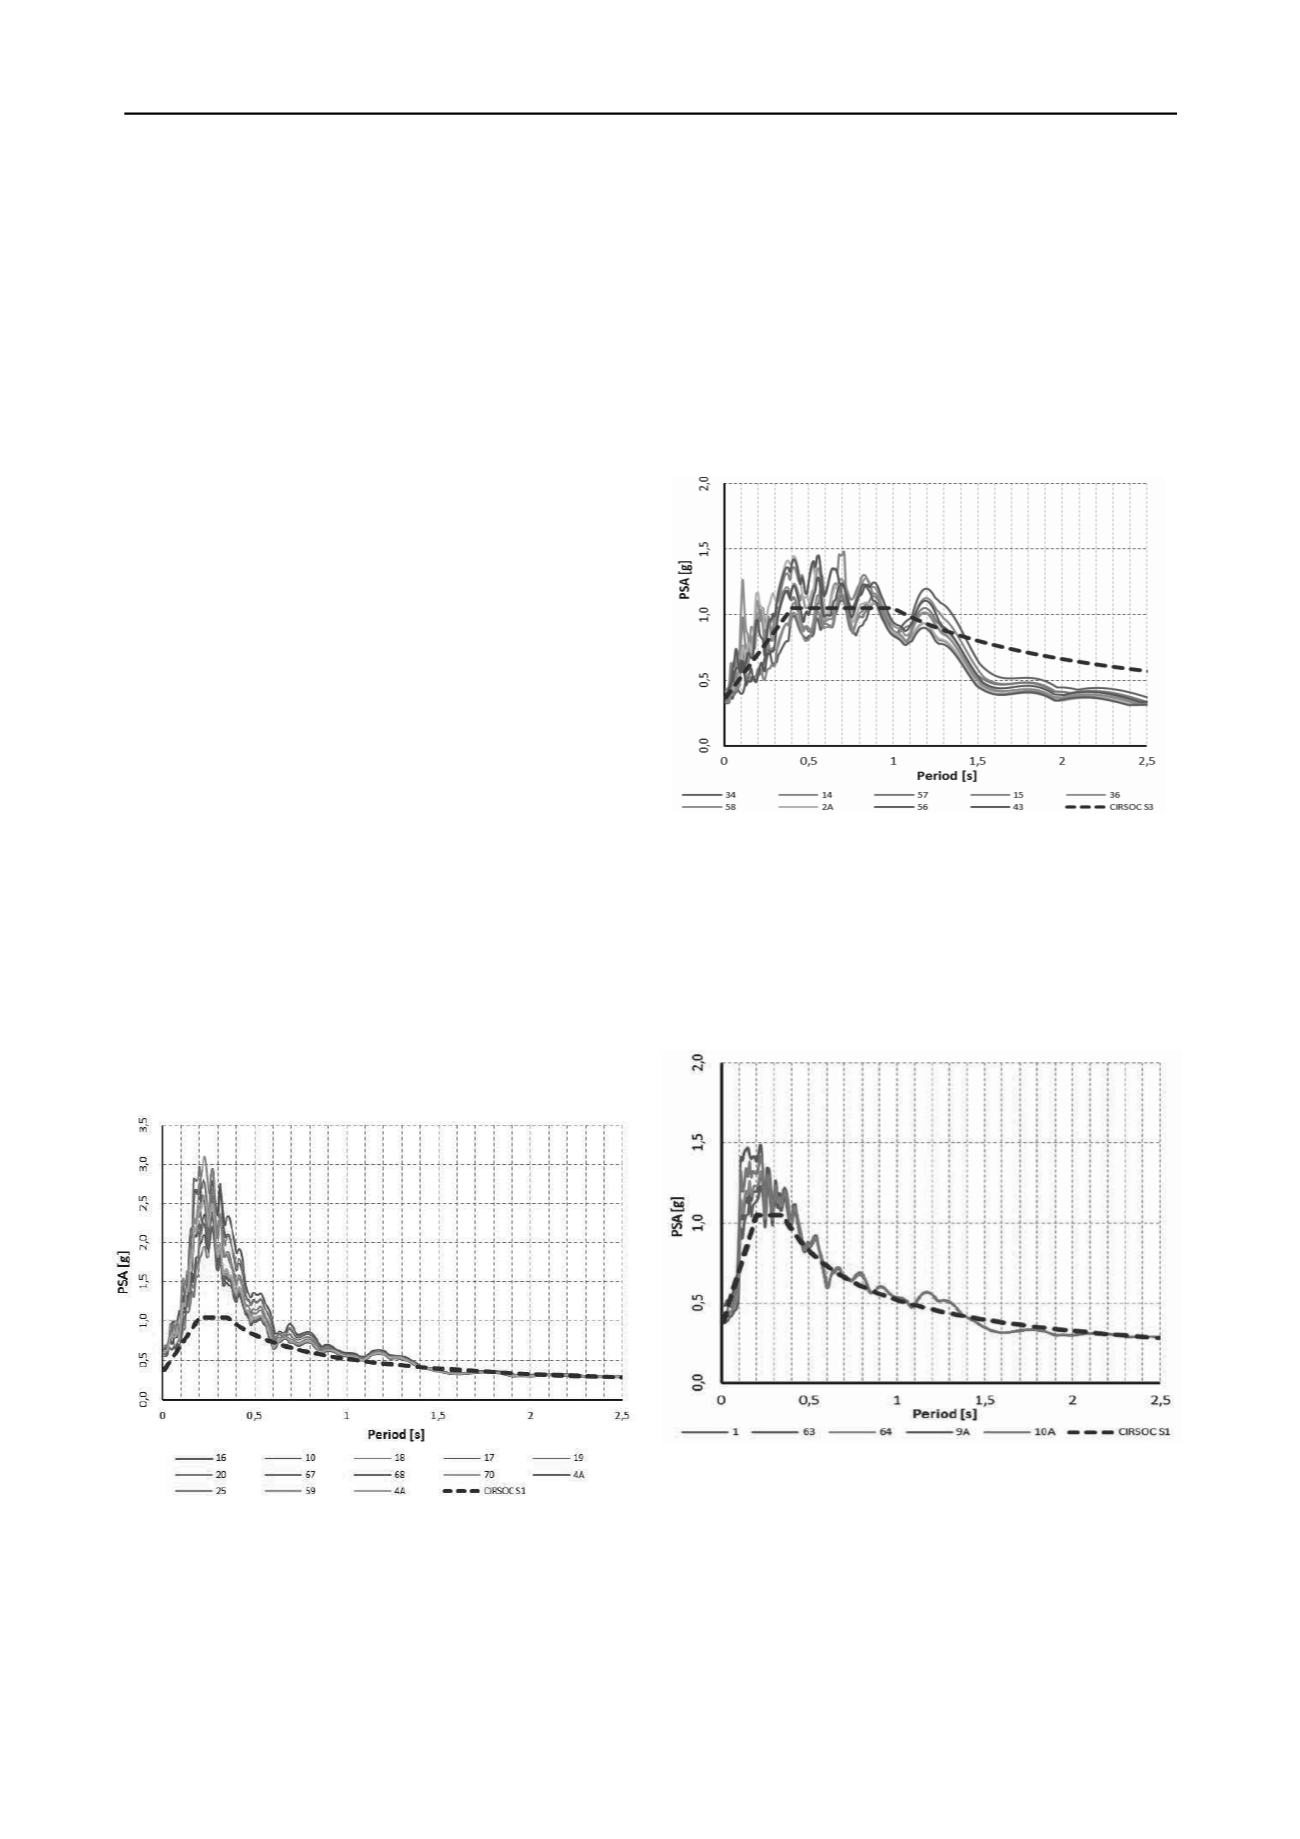
Figure 4: Response spectra, Zone 2, earthquake CIRSOC 103, Ao =
0.35g
Particularly we point out that the seismic zoning presented
here was developed only at response level because the
development of design spectra is an outstanding work until
now. In the same sense comparisons between structural
response spectra and earthquake design spectra in Figures 4, 5
and 6 has only an illustrative character being not directly
applicable.
In this project 72 geotechnical profiles were modeled.
Results led to propose six zones characterized by a typical
response spectrum shape.
Figure 7 shows a map whit the preliminary proposed
zonation. In the following each of these six zones is briefly
described.
In Figures 4, 5 and 6 numeric references correspond to
profiles taken from Poder Ejecutivo Nacional 1989; numeric
references followed by “A” correspond to profiles taken from
Barchiesi 2009 and the references “CIRSOC S1” to “CIRSOC
S3” correspond to the spectra for “1” to “3” soil types into the
regulation INPRES 1991 according to the studied site.
Figure 5: Response spectra, Zone 3, earthquake CIRSOC 103, Ao = 0.35g
Zone 1 showed the following response parameters: a
máx
=
(1.20 ÷ 2g) and T = (0.09 ÷ 0.18s). This zone is located into the
area of coarse deposits for the alluvial cone, with predominance
of coarse deposits to the south and with the presence of shallow
silty layers with 2 to 4m thickness and the presence of deeper
profiles with sands and silts associated to piedmont streams.
Figure 6: Response spectra, Zone 6, earthquake CIRSOC 103, Ao =
0.35g
Figure 4 shows the spectra of Zone 2, a = (2.2 ÷ 3g) and
máx
T = (0.19 ÷ 0.30s), corresponding to fine deposits for the
Alluvial Cone, with profiles characterized by shallow sands and
silts 7 to 10m in thickness overlaying gravels with high shear
wave velocity.
Figure 5 shows the spectra corresponding to Zone 3, a
máx
=
(1.1 ÷ 1.38g) and T = (0.45 ÷ 1.00s) with deep fine deposits
located into the alluvial plain with strong variable thicknesses
between 18 to 42m that lie upon high shear wave velocities
gravels.


