1437
Technical Committee 203 /
Comité technique 203
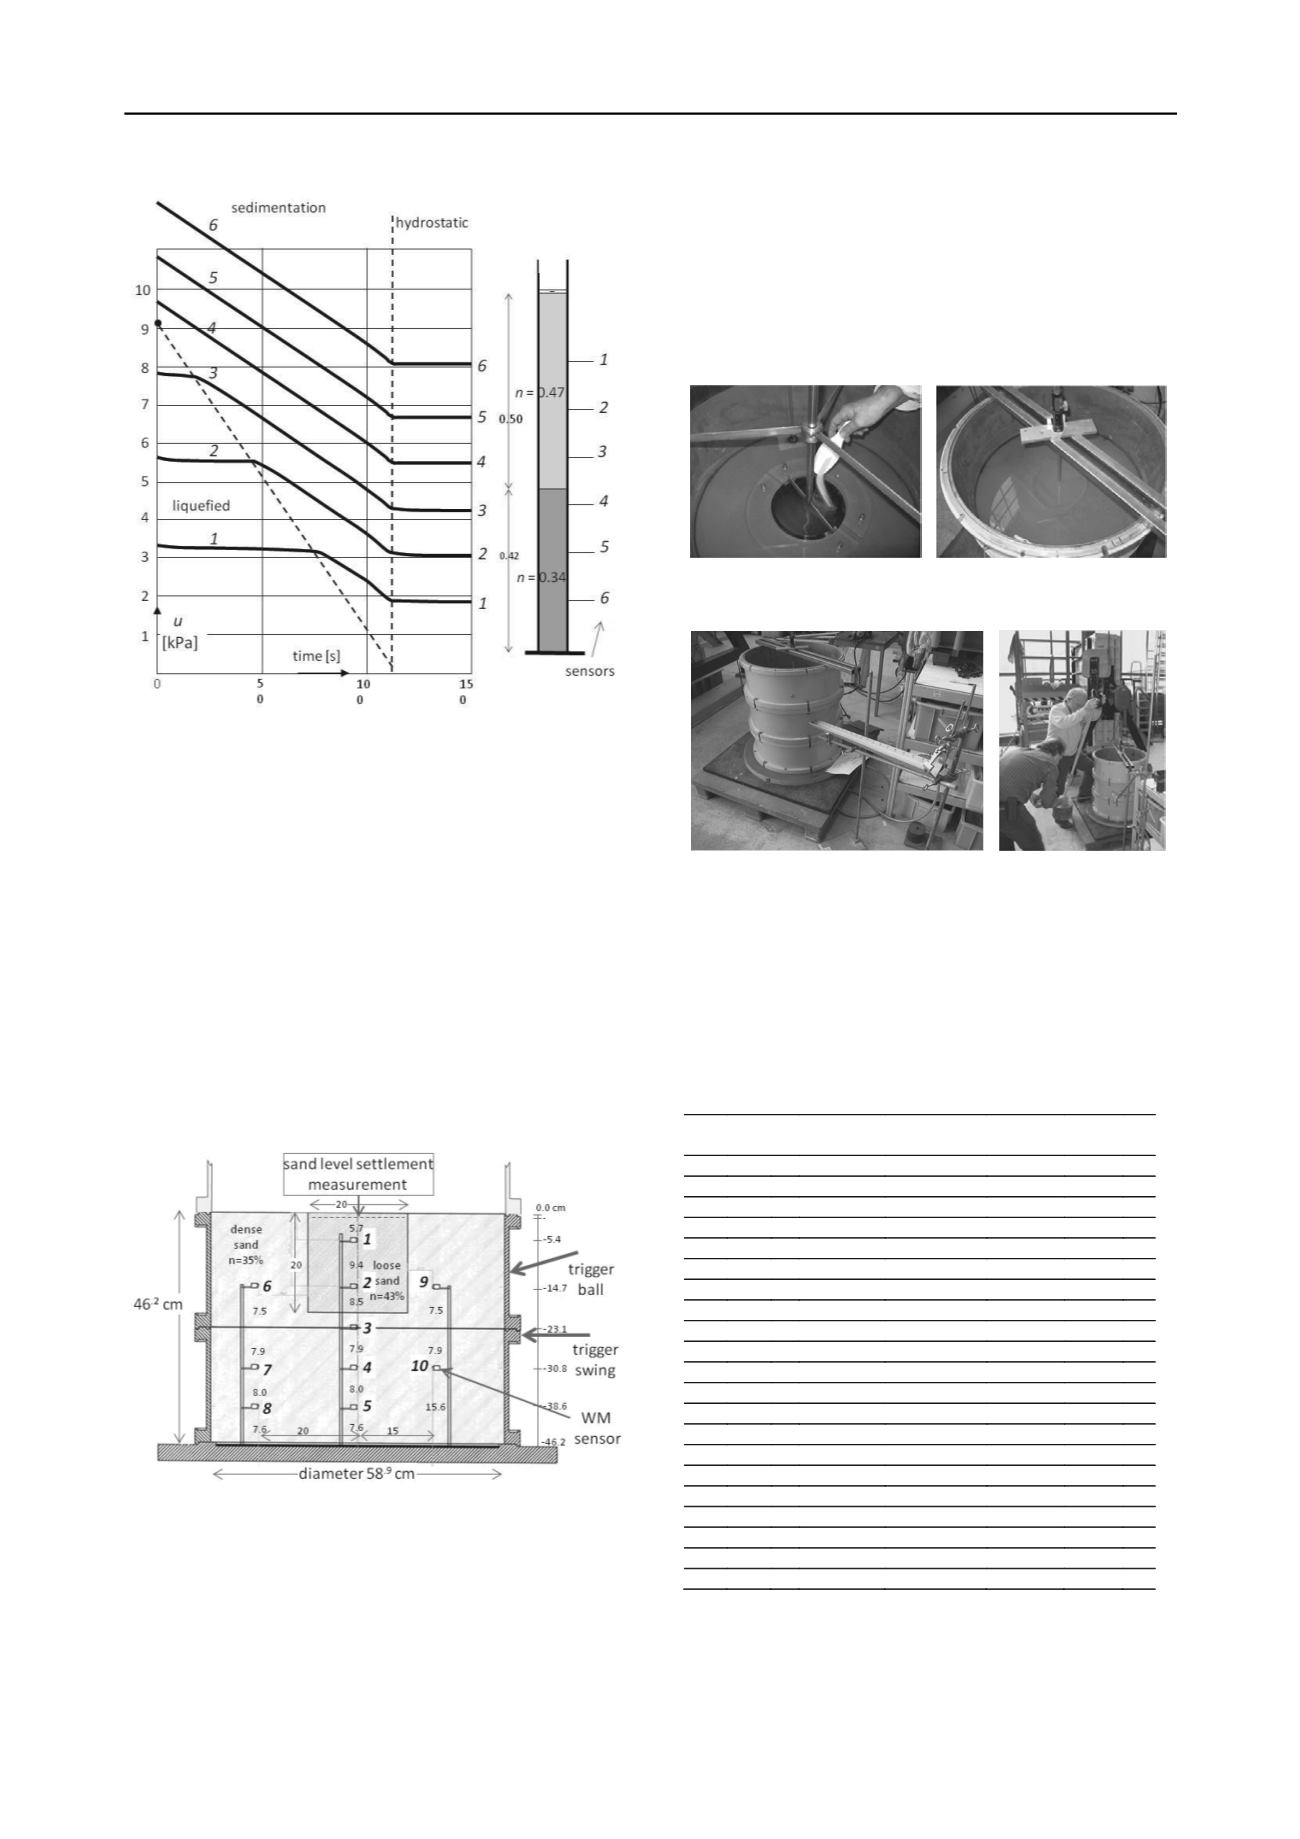
Figure 4. Typical pore pressure recording a full liquefying impact. The
inclined dotted line reflects the time of a sensor showing liquefaction;
the black spot at the top shows the mud weight: 9.1/0.50 = 18.2 kN/m
3
.
2.3
3D liquefaction effect of packing and trigger
2.3.1
Test setup
In order to understand the three dimensional extent of excess
pore pressures induced by partial liquefaction, several 3D tests
in a circular tub with a diameter of 58.9 cm and a height of 46.2
cm have been performed. The tub was carefully filled with fully
saturated dense sand (
n
0.35) and in the top centre a small
cylinder with a diameter and height of 20 cm was specially
prepared with fully saturated loose sand (
n
0.43), using
special equipment and expertise, shown in Figure 5a-c. Baskarp
sand B15 (0.34<
n
<0.47,
s
= 26 kN/m
3
) was used.
Figure 5a. 3D test setup; WMs are indicated with large italic numbers
Ten micro sensors for measuring pore pressures were placed
on a fixed frame, two of which in the centre of the loose sand
cylinder (nr 1 and 2) and the others under and aside the loose
sand, as shown Figure 5a. From the outside, the tube was
subjected to a series of triggers with increasing impact. First
five times with a bullet of 0.017 kg and thereafter nine times
with a bullet of 0.670 kg, each rolling 100 cm over the gutter at
a slope of 20
o
(Figure 5d). Next, four impacts by a swing of
5.15 kg from a horizontal distance of 100 cm, subsequently
three with a swing weight of 25.6 kg from a horizontal distance
of 25, 50 and 75 cm (Figure 5e), and finally the tub was lifted
about 10 cm and dropped suddenly, imitating a quake. Thus, in
total 21 successive phases were executed. At each impact the
sensors recorded the induced excess pore pressures at frequency
rate of 200 Hz, and the settlement of the loose sand surface was
measured after every phase.
Figure 5b. Preparing loose sand Figure 5c. Ready for testing.
Figure 5d. Rolling trigger bullet system Figure 5e. Trigger swing
2.3.2
Recorded data, excess pore pressures
Much data was collected and elaborated to illustrate the
effect of the trigger intensity and the induced excess pore
pressures in the loose sand volume and around in the dense
sand. Most relevant data are collected in Table 1.
Table 1. Relevant recorded data during subsequent phases (impacts)
Phase Trigger
Kg, cm
Liquefaction
at WM1 sec
Sedimentation
period sec
Settlement
cm
WM2
max
KPa
n
%
1
checking sensors
2 0.017 100 none
0.8
0.04
0.412 43.0
3 0.017 100 none
0.7
0.03
0.380 42.8
4 0.017 100 none
0.6
0.02
0.353 42.7
5 0.017 100 none
0.6
0.01
0.335 42.7
6 0.67 100 none
1.0
0.0
0.638 42.7
7 0.67 100 not registered, miscommunication ITC and lab
8 0.67 100 none
1.0
0.0
0.600 42.7
9 0.67 100 none
1.0
0.0
0.552 42.7
10 0.67 100 none
1.0
0.0
0.539 42.7
11 0.67 100 none
1.0
0.04
0.542 42.6
12 0.67 100 none
1.0
0.01
0.535 42.6
13 0.67 100 none
1.0
0.0
0.517 42.6
14 0.67 100 none
1.0
0.0
0.500
42.6
15 5.14 100 not registered, miscommunication ITC and lab
16 5.14 100 3.0
8.0
0.25
1.43* 42.2
17 5.14 100 2.5
6.5
0.25
1.43* 41.9
18 25.6 25 2.5
6.0
0.20
1.43* 41.5
19 25.6 50 3.3
7.0
0.20
1.43* 41.2
20
#
25.6 75 3.3
7.0
0.15
1.43* 41.0
21 quake 10 3.4
7.1
0.15
1.43* 40.8
* at WM2 the sand was liquefied during about 1 second
#
Phase 20 taken as reference for determining the porosity
Considering as an indication a sedimentation coefficient
s
v
1.5 10
-3
m
2
/s similar as in Section 2.2 (same sand), one may
conclude that during the Phase 2 with the lightest bullet the
liquefied zone reached only the top, less than
h
= (
s
v
t
2
)
0.5
= 3.4


