1428
Proceedings of the 18
th
International Conference on Soil Mechanics and Geotechnical Engineering, Paris 2013
leading to reasonable stresses acting on the soil medium at the
in-situ stress calculation phase.
3.1
Anchor block
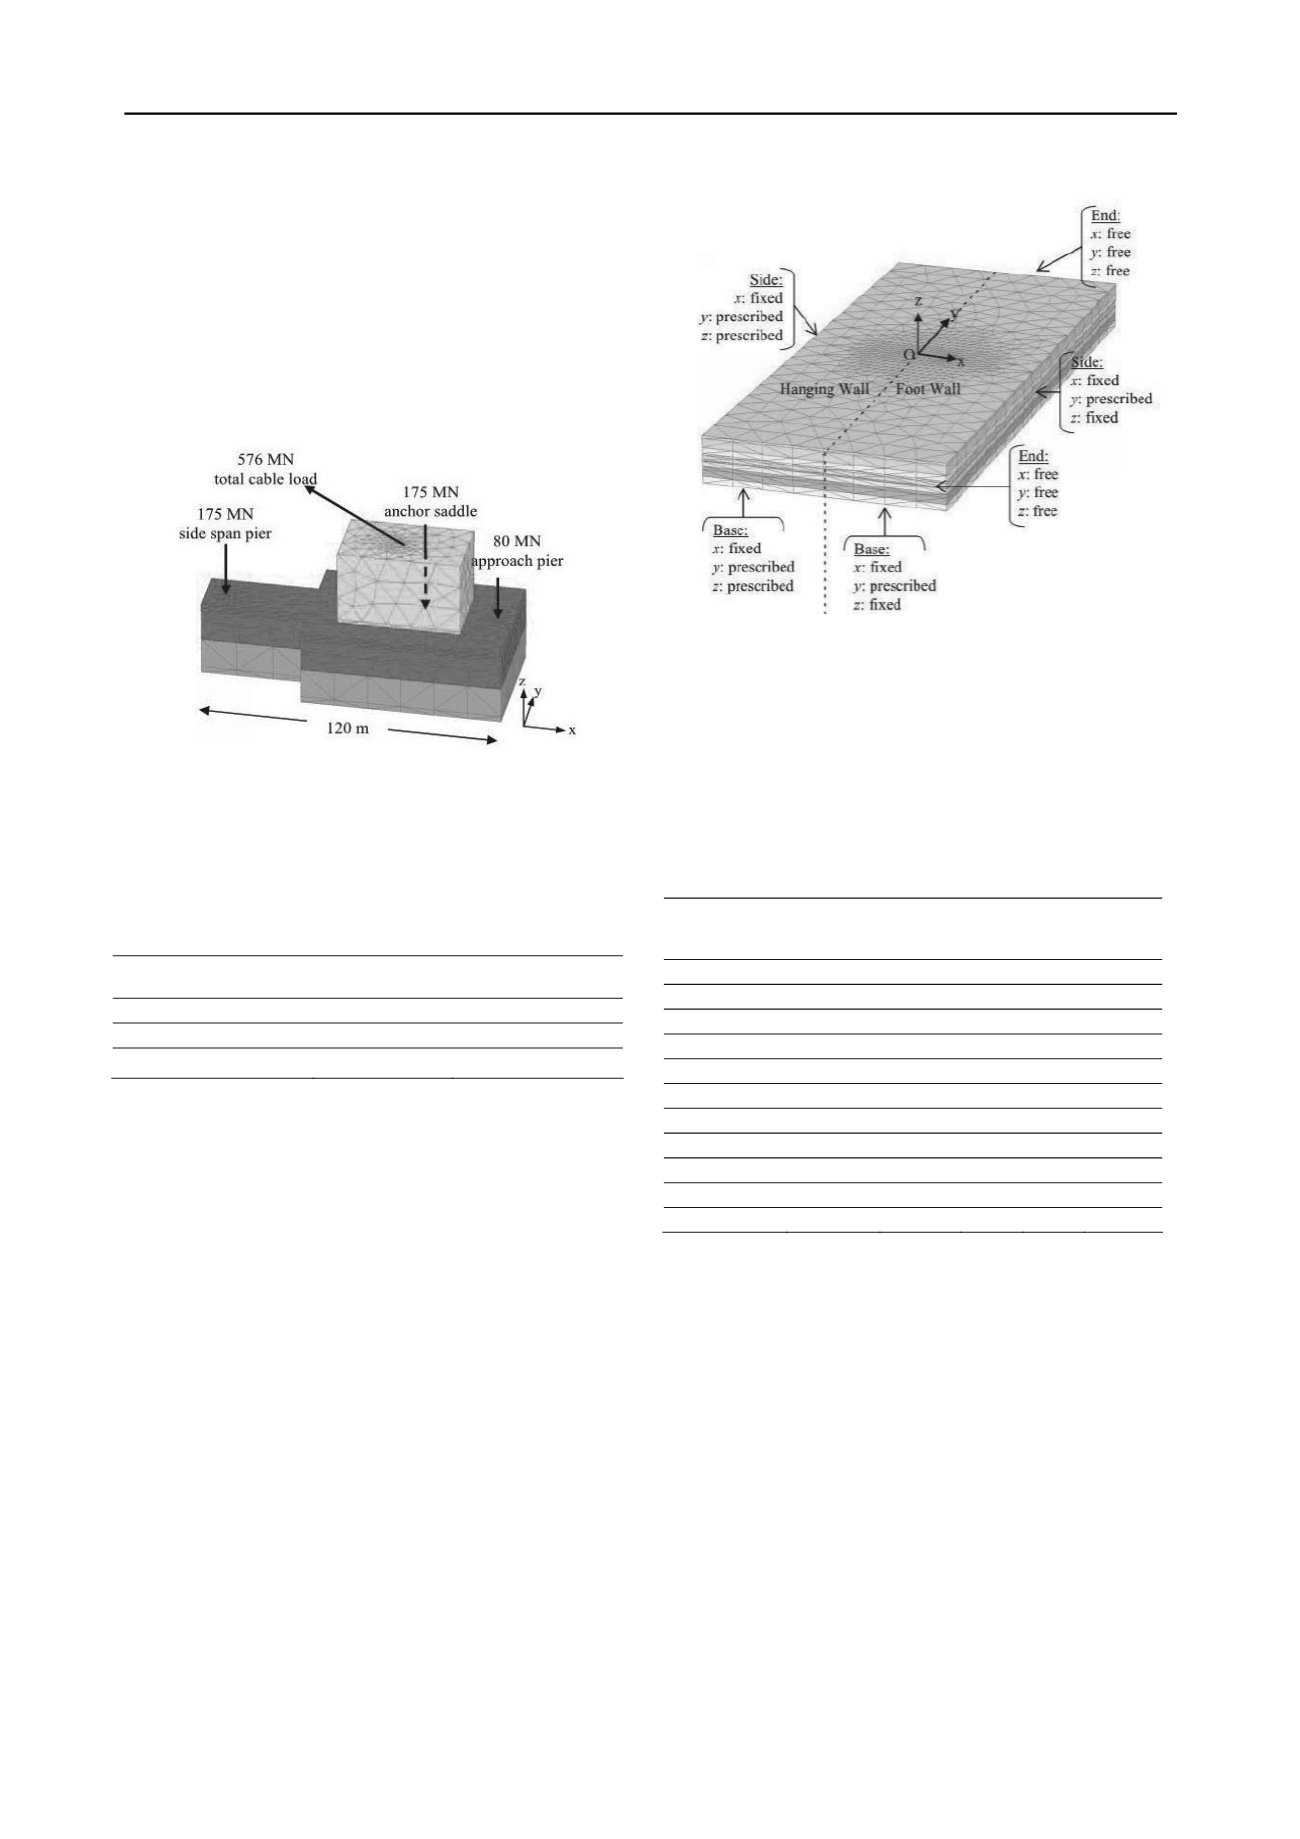
A simplified model has been used to create the massive
foundation block and the improved soil zone beneath it (see Fig.
2). The massive foundation block of the anchor has been
modelled using linear elastic (non-porous) material continuum
elements. The loads acting on the anchor block are shown in
Fig. 2.
Figure 2. Anchor block model in PLAXIS 3D and structural loads.
The zone beneath the massive foundation improved by bored
piles has been modelled as an equivalent soil volume assuming
linear elastic (non-porous) material (Table 1). The interface
between the surrounding soil and the anchor block and the
improved zone is assumed rigid as a conservative idealisation.
Table 1. Anchor block characteristic material parameters.
Description
[kN/m
3
]
E
[kPa]
Anchor Block
25
30 x 10
6
Improved Zone
21
4.22 x 10
6
Anchor Saddle Block
0
300 x 10
6
3.2
Fault displacements
The lateral and vertical displacements are applied to the base of
the soil medium at a depth of 100 m resulting in a more intense
diversion of the fault rupture path (Anastasopoulos et al. 2008).
A lateral fault displacement of 1.0 m as a result of seismic
analysis has been modelled by applying 0.5 m movement in y-
direction constant with depth to each of the moving blocks in
opposite directions. For normal fault movement, a vertical
displacement of 0.5 m at a dip angle of 90 degrees to the
horizontal has been specified to the base and the vertical
boundary of the moving block on the hanging wall while the
other half of the base (footwall) displacement boundary remains
fixed (see Fig. 3).
3.3
Ground profile and constitutive model
The ground profile and the soil parameters used in the
PLAXIS 3D model are shown in Table 2. The constitutive
model adopted is the elasto-plastic model with standard Mohr-
Coulomb (MC) yield surface formulation. The MC model has
limitations in terms of modelling soil bifurcation and formation
of well-developed shear bands. However, the purpose here is
not the determination of the exact location of fault outcrop.
Therefore, the simplicity of built-in MC model is chosen over
other higher order models.
Figure 3.Boundary conditions in PLAXIS 3D model.
As the fault propagation through saturated fine-grained soil
deposits occurs too fast for excess pore water pressures to
dissipate, the analysis has been performed with undrained
conditions in the clay layers using effective parameters for
strength and stiffness, which is a method of calculating
undrained behaviour by PLAXIS. Drained conditions are
assumed in the sand layers. The groundwater level coincides
with the existing ground level at -1.7 m.
Table 2. Ground profile and characteristic soil parameters.
Description
Top
Level
[m]
[kN/m
3
]
φ'
tr
[
o
]
c'
[kPa]
E
oed
[MPa]
Fill
+3
20
35
-
50
SAND
-1.7
18.5
30
15
SAND
-7
19.4
35
52
CLAY
-27.5
19.9
24
9
47
SAND
-39.2
19.9
33.4
47
CLAY
-43
19.9
26
12
60
SAND
-51.5
20.9
35
80
CLAY
-54.7
20.9
26
12
90
SAND
-65.6
20.9
35
80
CLAY
-72.3
20.9
29
24
117
SAND
-86
20.9
35.6
80
K
0
values are equal to 1-sinφ'
tr
.
3.4
FE mesh
The large size of the model (700 m along bridge alignment,
1400 m perpendicular to alignment and 130 m vertically) has
been a limiting factor for the meshing. The mesh density has
been adjusted by creating finer mesh where the anchor block is
located. The FE mesh consists of 10-node tetrahedral 3D
elements. The number of elements used is 50287 to limit the
computing time.
3.5
Construction sequence
The construction modelling stages include the calculation of in-
situ stresses followed by building the anchor block and applying
the structural loads. The last stage is the application of fault
displacements.


