1421
Technical Committee 203 /
Comité technique 203
the reclaimed layer and the alluvial sand layer are the same, and
only the alluvial clay layer thickness (and diluvial deposit
thickness) in the deep part of the ground is different. The input
seismic waveform is also shown in Fig. 3. The seismic
waveform observed in the deep part of the ground in Chiba
Prefecture was obtained from Kik-net, amended on the basis of
the Vs value, and input to the seismic bedrock in earthquake
engineering at a depth of 60 m. The maximum acceleration is
only several tens of gals. Equal accelerations were input in the
horizontal direction to all nodal points, and based on on-site PS
logging that is currently being carried out, viscous boundaries
corresponding to Vs=300 m/sec were set in the horizontal
direction at all these nodal points on the bottom face.
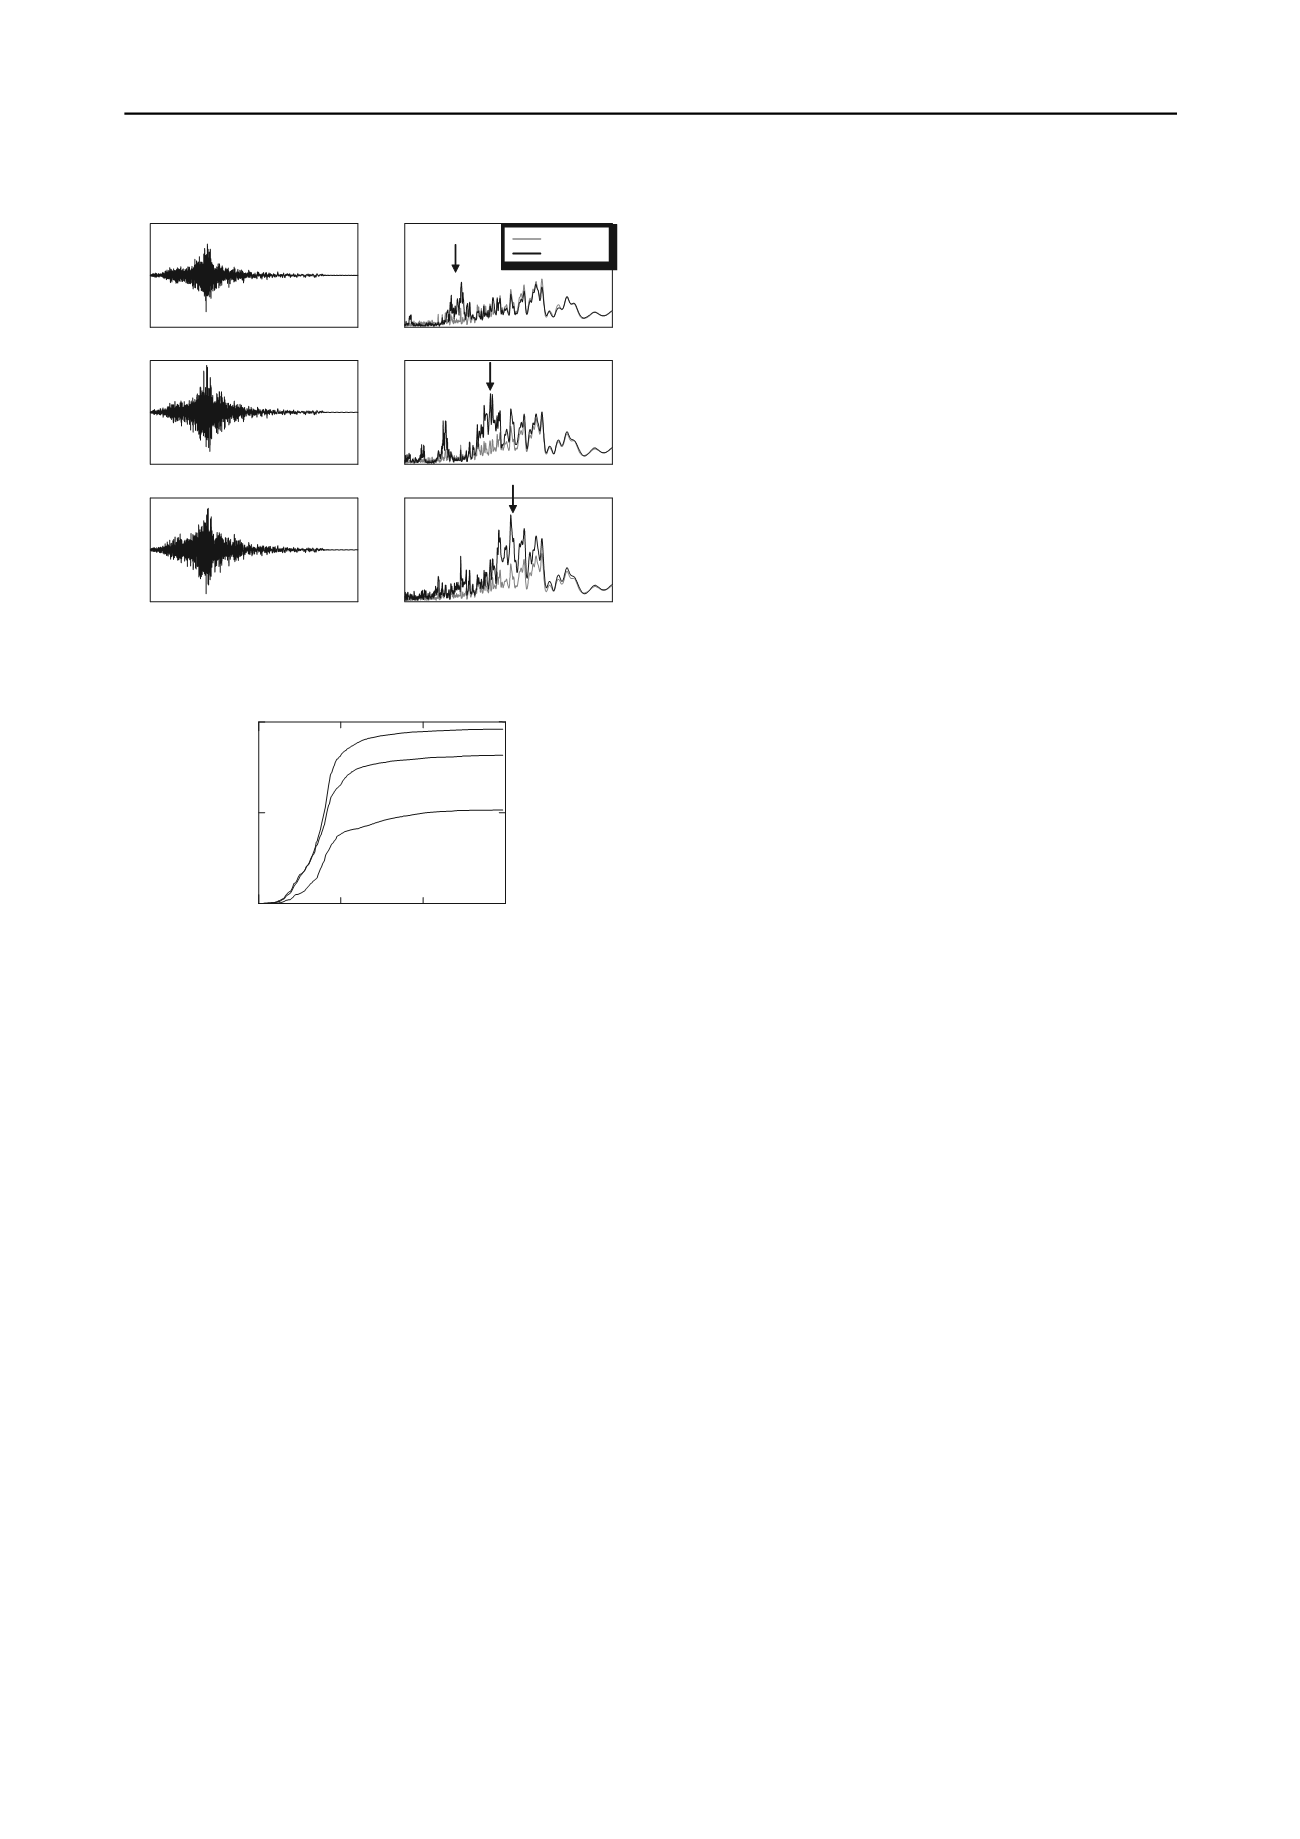
Figure 4 illustrates the horizontal acceleration responses and the
Fourier amplitude spectra after the seismic wave passed through
the alluvial clay layers (boundaries between alluvial clay and
alluvial sand) at locations A, B, and C. Compared with the input
seismic wave, there is almost no amplification of the
acceleration at location A, where the clay layer is thin, but it can
be observed that the acceleration is amplified as the thickness of
the clay layer becomes larger. In addition, it can be observed
from the Fourier amplitude spectra that the somewhat long-
period components of the seismic wave in the vicinity of 0.5–
0.7 sec at location B and 1–2 sec at location C have been
amplified with increasing thickness of the clay layer. Figure 5
depicts the variation of excess pore water pressure ratio with
time in the upper elements of the reclaimed layer. It is known
through experience that a ground can be judged to have been
liquefied if the excess pore water pressure ratio, which is an
index obtained by dividing the excess pore water pressure by
the effective overburden pressure before the earthquake,
exceeds 0.95. In Fig. 5, the excess pore water pressures are seen
to rise rapidly after 80 sec, which is in the vicinity of the time of
maximum acceleration. In the case of location C, where the clay
layer is thick, the excess pore water pressure ratio becomes
nearly 1.0, indicating liquefaction. However, the stage of
liquefaction has not been reached in the case of locations A and
B. Development of large plastic strains is necessary for
liquefaction to occur in intermediate soils with a fine fraction
content. For the development of such large strains, large
displacements and deformation caused by long-period ground
motion together with several repeated loading cycles is
required. As is clear from Fig. 4, the degree of amplification of
acceleration becomes higher and the periodic band of amplified
acceleration becomes larger with increasing thickness of the
alluvial clay deposit in the deeper part of the ground. This is
believed to be the reason why liquefaction occurred even in the
case of silty sand with fine fraction content. This shows that,
even if the conditions of the liquefied surface layers (reclaimed
layer and alluvial sand layer) are the same, the level of
liquefaction could vary solely due to the difference in the
thickness of the alluvial clay deposits in the deeper part of the
ground. Conventionally, in the FL method or simple
microtopographic classification methods, only the "soil texture"
of the surface layer becomes an issue, and other factors such as
duration, stratum organization in deeper ground, etc. are not
directly considered to be issues. The computed results described
above suggest the necessity of utilizing leading-edge
computational geomechanics based on elasto-plastic mechanics.
10
-1
10
0
10
1
0
100
0
100
200
300
- 100
0
100
Period (sec)
Time (sec)
Fourier Amplitude (gal*s)
Acceleration (gal)
10
-1
10
0
10
1
0
100
0
100
200
300
- 100
0
100
Period (sec)
Time (sec)
Fourier Amplitude (gal*s)
Acceleration (gal)
10
-1
10
0
10
1
0
100
0
100
200
300
- 100
0
100
Period (sec)
Time (sec)
Fourier Amplitude (gal*s)
Acceleration (gal)
base
Above clay
Location A
Location C
Location B
Figure 4. Horizontal acceleration responses and Fourier amplitude
spectra after the seismic wave passed through the alluvial clay layers
(alluvial clay/alluvial sand boundaries) at locations A, B, and C
0
100
200
300
0
0.5
1
Time (s)
Excess pore water pressure ratio
A
B
C
Figure 5. Excess pore water pressure ratios in the upper elements
3 EFFECT OF THE INCLINATION OF DEEP STRATA ON
THE SEISMIC BEHAVIOUR OF GROUND
In section 2 above, it was shown through one-dimensional
elasto-plastic seismic response analysis of multi-layer ground at
Urayasu City that the liquefaction damage observed in the
ground with a fine fraction content was due to the presence of a
thick layer of weak clay below the liquefied layer in addition to
other factors such as the long duration of the earthquake and
differences in the time of reclamation work execution. It was
pointed out that in the weak clay layer, even if the maximum
acceleration is small, there is a possibility of long-period
acceleration responses occurring, leading to many repeated
loading cycles that could cause development and storage of
large strains and result in liquefaction. In this section, two-
dimensional analysis was carried out taking account of the
sloped boundary between the alluvial clay layer and the diluvial
deposit below it. Figure 6 shows the finite element mesh used in
the analysis. The width of the region analyzed is 6,000 m, and
its depth is 60 m. In the 1800-m area at the middle of the region,
a 2.2% slope was established at the boundary between the
alluvial clay layer and the diluvial deposit, taking account of the
actual stratum organization in Urayasu City (Fig. 2). The
symbols A’, B’, and C’ in Fig. 6 indicate that these locations
have the same stratum organizations as those of locations A, B,
and C in the case of the one-dimensional model studied in
section 2. Computational conditions such as ground conditions
and boundary conditions were the same as in the analysis done
in section 2.
Figure 7 illustrates the shear strain distribution 150 sec after
earthquake occurrence. Only the area around the sloped part of
the layer is shown in this figure, and the scale in the vertical
direction has been magnified 8 times. Although shear strains are
small in the non-inclined horizontal strata, large strains are
produced in the reclaimed layer and in the sloped alluvial layer.
Furthermore, this strain distribution is nonuniform and localized
and increases with increasing thickness of the alluvial layer. The
distribution of the excess pore water pressure ratio 150 sec after
earthquake occurrence is illustrated in Fig. 8 and is seen to be
nonuniform as in the case of shear strain. Liquefaction has
occurred (excess pore water pressure ratios higher than 0.95)
over a wide area in the sloped strata. Looking at the reclaimed
layer, it can be seen that liquefaction has occurred at location


