1418
Proceedings of the 18
th
International Conference on Soil Mechanics and Geotechnical Engineering, Paris 2013
Proceedings of the 18
th
International Conference on Soil Mechanics and Geotechnical Engineering, Paris 2013
Table 2. The intrinsic parameters that characterize liquefaction resistance, G
0
and V
s1
-CRR correlation for tested materials
Fines Type and Content
(FC)
Intrinsic Values
for Eq. (1)
Intrinsic Values
for Eq. (3)
Intrinsic Values
for Eq. (6)
Tested
Material
Silt
Kaolin Bentonite
a
×10
-2
b
R
2
C
g
n
g
a
g
R
2
K
c
×10
-4
n
c
F0-0
0
0
0
9.02
-3.75
0.97
389
0.48
-1.84
0.95
7.48
2.04
FS-5
5%
0
0
10.44
-2.77
0.92
380
0.49
-1.05
0.97
11.25
2.64
FS-15
15%
0
0
3.39
-3.80
0.94
249
0.51
-1.55
0.96
10.10
2.45
FK-5
0
5%
0
4.87
-4.90
0.99
335
0.48
-1.41
0.97
13.10
3.47
FK-15
0
15%
0
3.12
-3.01
0.89
115
0.36
-3.10
0.97
1.68
0.97
FB-5
0
0
5%
5.44
-4.14
0.99
290
0.46
-2.18
0.97
6.85
1.90
FB-15
0
0
15%
5.12
-4.16
1.00
197
0.43
-2.70
0.99
6.30
1.54
0.00
0.05
0.10
0.15
0.20
0.25
0.30
0.35
0.40
0.45
0.50
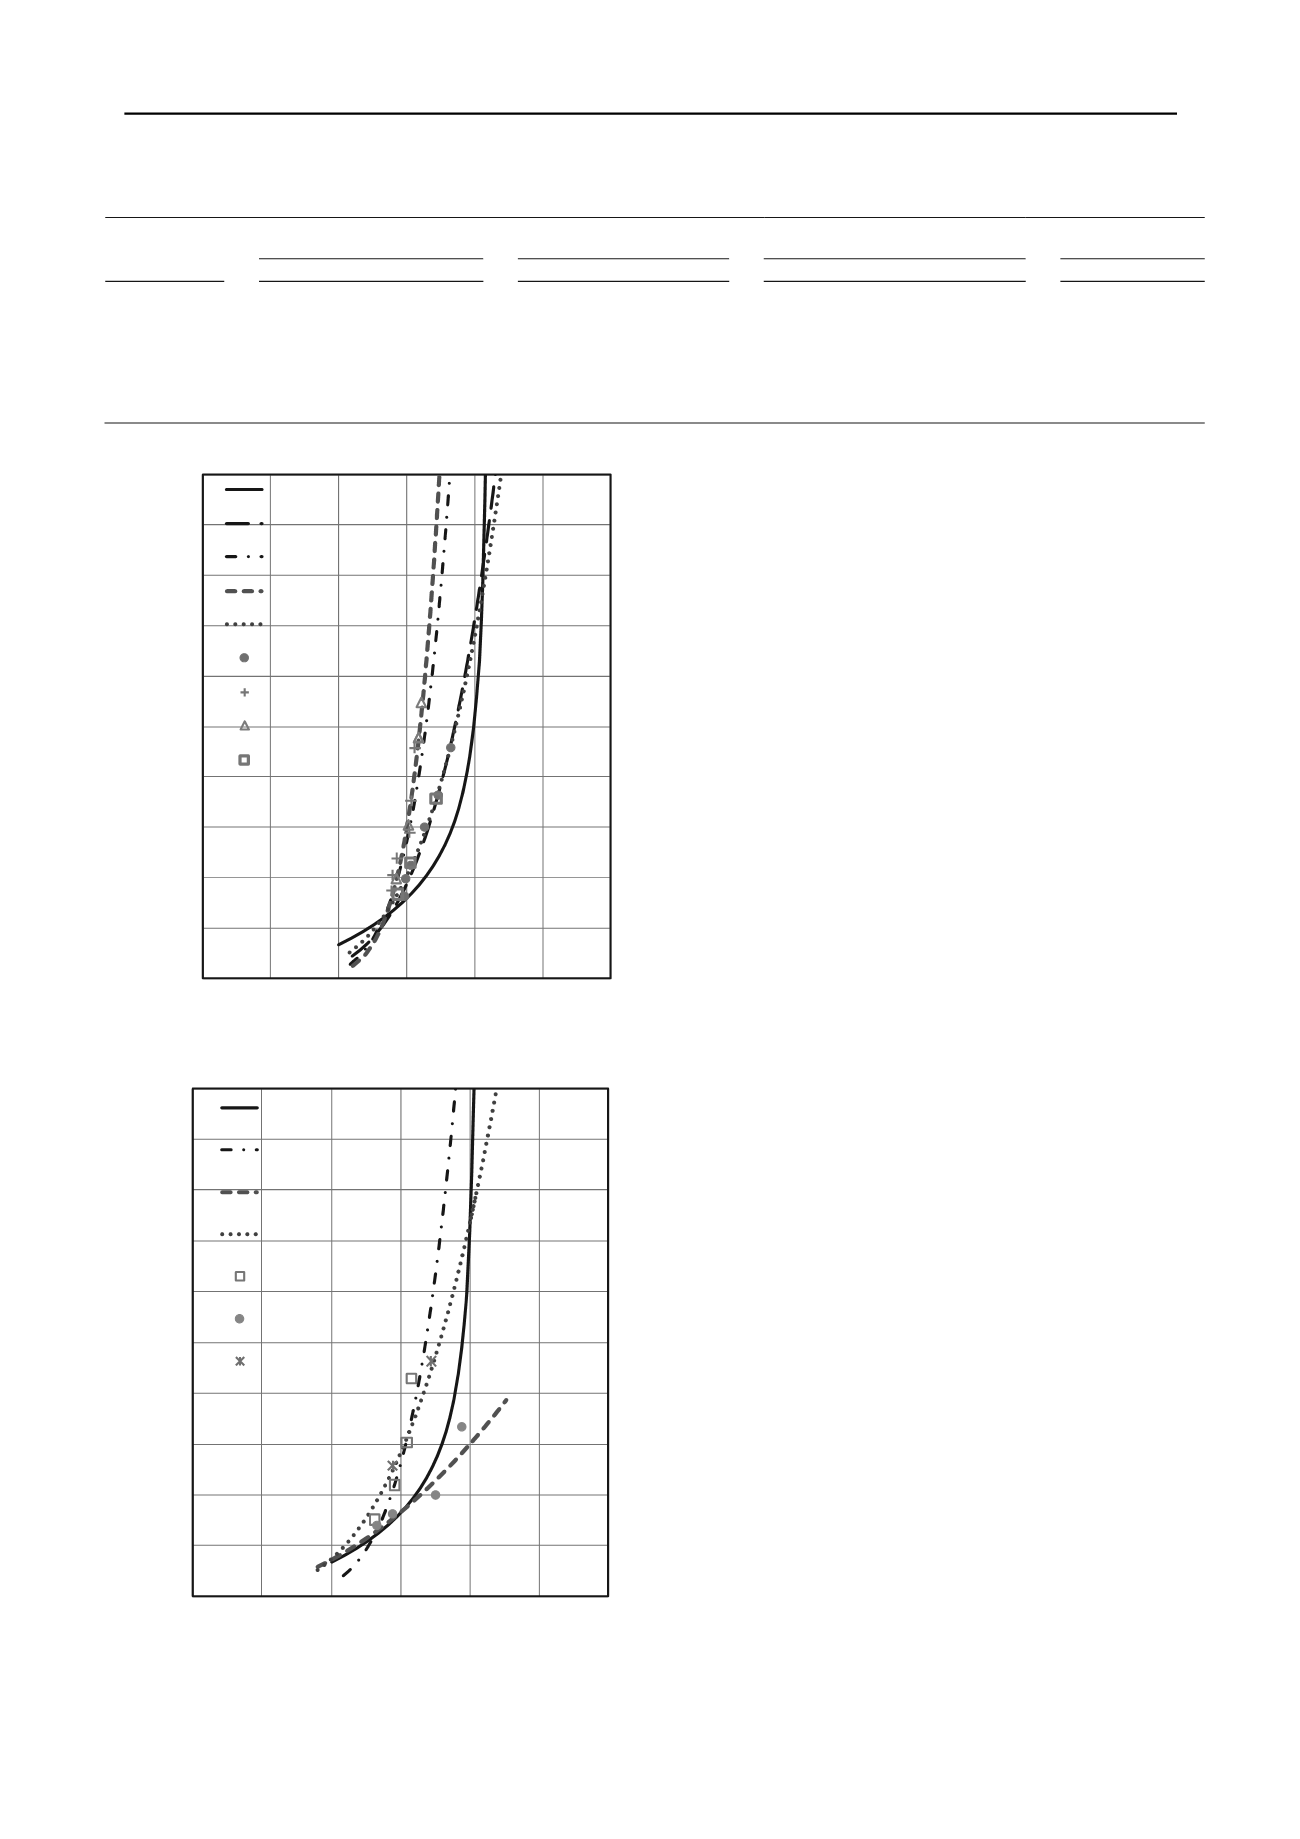
0
50
100
150
200
250
300
CSR
V
s1
(m/s)
Andrus & Stokoe
(2000)-FC≤5%
F0-0 (Eq.6)
FS-5 (Eq.6)
FK-5 (Eq.6)
FB-5 (Eq.6)
F0-0 (Test)
FS-5 (Test)
FK-5 (Test)
FB-5 (Test)
No Liquefaction
Liquefaction
Figure 5. Correlation between CRR and V
s1
for sand with FC≤5%
0.00
0.05
0.10
0.15
0.20
0.25
0.30
0.35
0.40
0.45
0.50
0
50
100
150
200
250
300
CSR
V
s1
(m/s)
Andrus & Stokoe
(2000)-FC=15%
FS-15 (Eq.6)
FK-15 (Eq.6)
FB-15 (Eq.6)
FS-15 (Test)
FK-15 (Test)
FB-15 (Test)
No Liquefaction
Liquefaction
Figure 6. Correlation between CRR and V
s1
for sand with FC=15%
Based on Figure 5, there is a relatively good agreement
between the existing method proposed by Andrus and Stoke
(2000) and results of this experiment for clean sand and sand
containing 5% Bentonite clay. However, for sand containing 5%
of silt or Kaolin clay, using the existing curves leads to
conservative results. According to Figure 6, for 15% of fines
content, the existing method may overestimate or underestimate
the liquefaction resistance depending on the fines type.
In general based on the presented results, one can say that
the correlation between CRR and V
s1
is soil specific. It suggests
the need for development of soil-specific correlations from
laboratory tests for a specified soil.
5 CONCLUSIONS
In this paper, cyclic triaxial and bender elements tests were
performed on clean sand and sand containing 5 and 15% non-
plastic, low-plastic and highly-plastic fines to investigate the
effect of fines type on the CRR-V
s1
correlation. A semi
empirical equation is established to correlate the CRR and V
s1
.
According to the developed CRR-V
s1
correlations for tested
materials, it is found that the correlation depends on fines nature
in addition to fines content. Therefore, the correlation between
CRR and V
s1
must be considered soil specific. The curves of
Andrus and Stokoe (2000) may either underestimate or
overestimate the liquefaction resistance of sand-fines mixtures.
6 REFERENCES
Andrus R.D. and Stokoe K. H. II. 2000. Liquefaction resistance of soils
from shear-wave velocity. J. Geotech. Geoenviron. Eng., 126(11),
1015–1025.
Huang Y.T., Huang A. B., Kuo, Y.C. and Tsai, M.D. 2004. A laboratory
study on the undrained strength of a silty sand from Central
Western Taiwan. Soil Dyn. Earthquake Eng. 24, 733–743.
Ishihara K. 1993. Liquefaction and flow failure during earthquakes.
Geotechnique 43(3), 351–415.
Jamiolkowski M., Leroueil S. and Lo Presti, D.C.F. 1991. Theme
lecture: Design parameters from theory to practice. Proc., Geo-
Coast ’91, Vol. 2, 877–917.
Lee J.S. and Santamarina J.C. 2005. Bender elements: performance and
signal interpretation. J. of Geotech. Geoenviron. Eng., 131(9),
1063-1070.
Seed H.B. 1979. Soil liquefaction and cyclic mobility evaluation for
level ground during earthquakes. J. Geotech. Eng. Div., Am. Soc.
Civ. Eng., 105(2), 201–255.
Seed H.B. and Idriss I.M. 1971. Simplified procedure for evaluating soil
liquefaction potential. J. Soil Mech. and Found. Div., 97(9), 1249-
1273.
Tokimatsu K. and Uchida A. 1990. Correlation between liquefaction
resistance and shear wave velocity. Soils Found. 30(2), 33–42.
Youd T.L. et al. 2001. Liquefaction resistance of soils: Summary report
from the 1996 NCEER and 1998 NCEER/NSF workshops on
evaluation of liquefaction resistance of soils. J. Geotech.
Geoenviron.Eng., 127(10), 817–833.
Zhou Y.G. and Chen Y.M. 2007. Laboratory investigation on assessing
liquefaction resistance of sandy soils by shear wave velocity. J.
Geotech. Geoenviron. Eng. 133(8), 959–972.


