 
          1409
        
        
          Technical Committee 203 /


            Comité technique 203


          Table 2. Modelling parameters of the SYS Cam-clay model
        
        
          Elasto-plastic parameters
        
        
          Minimum value
        
        
          0.0025
        
        
          Compression index


            λ


          Maximum value
        
        
          0.05
        
        
          Reference value of


            γ


          p
        
        
          for


            λ  γ


          λ
        
        
          0.0001
        
        
          Minimum value
        
        
          0.0015
        
        
          Swelling index


            κ


          Maximum value
        
        
          0.049
        
        
          Reference value of


            γ


          p
        
        
          for


            κ


            γ


          κ
        
        
          0.01
        
        
          Critical state constant


            M


          0.90
        
        
          Specific volume at q = 0 and p ’= 98.1 kPa on NCL


            N


          1.785
        
        
          Poisson’s ratio
        
        
          0.264
        
        
          Cohesion (kPa)
        
        
          8 0
        
        
          4 ANALYTICAL RESULT
        
        
          4.1


            FEM


          Figure 7 shows analytical and test results of lateral response
        
        
          acceleration and displacement at observation points shown in
        
        
          Figure 8 (a). The analytical results are largely consistent with
        
        
          the test results. Figure 8 (b) to (d) shows distributions of
        
        
          amplitude of lateral response acceleration and maximum
        
        
          shear strain when the amplitude of lateral response
        
        
          acceleration is the minimum. In test results, the lateral
        
        
          response acceleration is amplified at the top and right hand
        
        
          side slope as shown in Figure 8 (b). Large amplification of
        
        
          the lateral response acceleration is produced at middle part
        
        
          of the right hand side slope, where partial catastrophic failure
        
        
          occurred (see Figure 2 (a)). On the other hand, although the
        
        
          analysis can describe overall behavior of amplification and
        
        
          phase lag of lateral response acceleration as shown in Figure
        
        
          8 (c), that cannot describe localized amplification of lateral
        
        
          response acceleration at right hand side slope shown in
        
        
          Figure 8 (b) seen in test. Also, shear strain growth is
        
        
          prominent at the toe of right hand side slope as shown in
        
        
          Figure 8 (d), which is inconsistent with a middle part of the
        
        
          slope where partial catastrophic failure occurred. This
        
        
          indicates that the used FEM model is applicable to describe
        
        
          overall behavior of amplification and phase lag of lateral
        
        
          response acceleration, but the model has problems to solve to
        
        
          deal with shear strain growth due to localized amplification
        
        
          of lateral response acceleration.
        
        
          4.2


            MPM


          Figure 9 and Figure 10 show processes of distributions of
        
        
          maximum shear strain and lateral response acceleration
        
        
          derived from MPM analysis. In one layered model,
        
        
          analytical results show catastrophic failure at right hand side
        
        
          slope, but the amount of deformation is overestimated
        
        
          comparing to test results. In three layered model, final
        
        
          configuration derived from the analysis is largely consistent
        
        
          with that of the test. Figure 11 shows time histories of lateral
        
        
          and vertical response displacement at observation points
        
        
          displayed in Figure 10 (a) introduced from test and analysis.
        
        
          Start time and rate of change of displacement derived from
        
        
          the analysis is largely consistent with that in the test. These
        
        
          indicate that the MPM analysis can deal with the large
        
        
          deformation such as slide down although a constitutive law
        
        
          was modeled up to residual state as shown in Figure 6.
        
        
          5 CONCLUSION
        
        
          Seismic behavior of large-scale slope model on the world’s
        
        
          largest shaking table test was analyzed by FEM and MPM.
        
        
          The outcomes can be summarized as follows:
        
        
          1) The same trend of the amplification and phase lag of
        
        
          response acceleration at the top of slope of one layered slope
        
        
          model as that seen at the shaking table test could be obtained
        
        
          by the FEM with GHE-S model together with the multiple
        
        
          nonlinear spring models. However, the FEM model could
        
        
          not describe the localized amplification of response
        
        
          acceleration and shear strain growth at the middle part of the
        
        
          slope where partial catastrophic failure occurred.
        
        
          0.000001 0.00001 0.0001 0.001
        
        
          0.01
        
        
          0.1
        
        
          0
        
        
          0.2
        
        
          0.4
        
        
          0.6
        
        
          0.8
        
        
          1
        
        
          0
        
        
          0.1
        
        
          0.2
        
        
          0.3
        
        
          0.4
        
        
          0.5
        
        
          G/G
        
        
          0


          減衰
        
        
          , h
        
        
          実験値
        
        
          解析値
        
        
          Model
        
        
          Test
        
        
          h
        
        
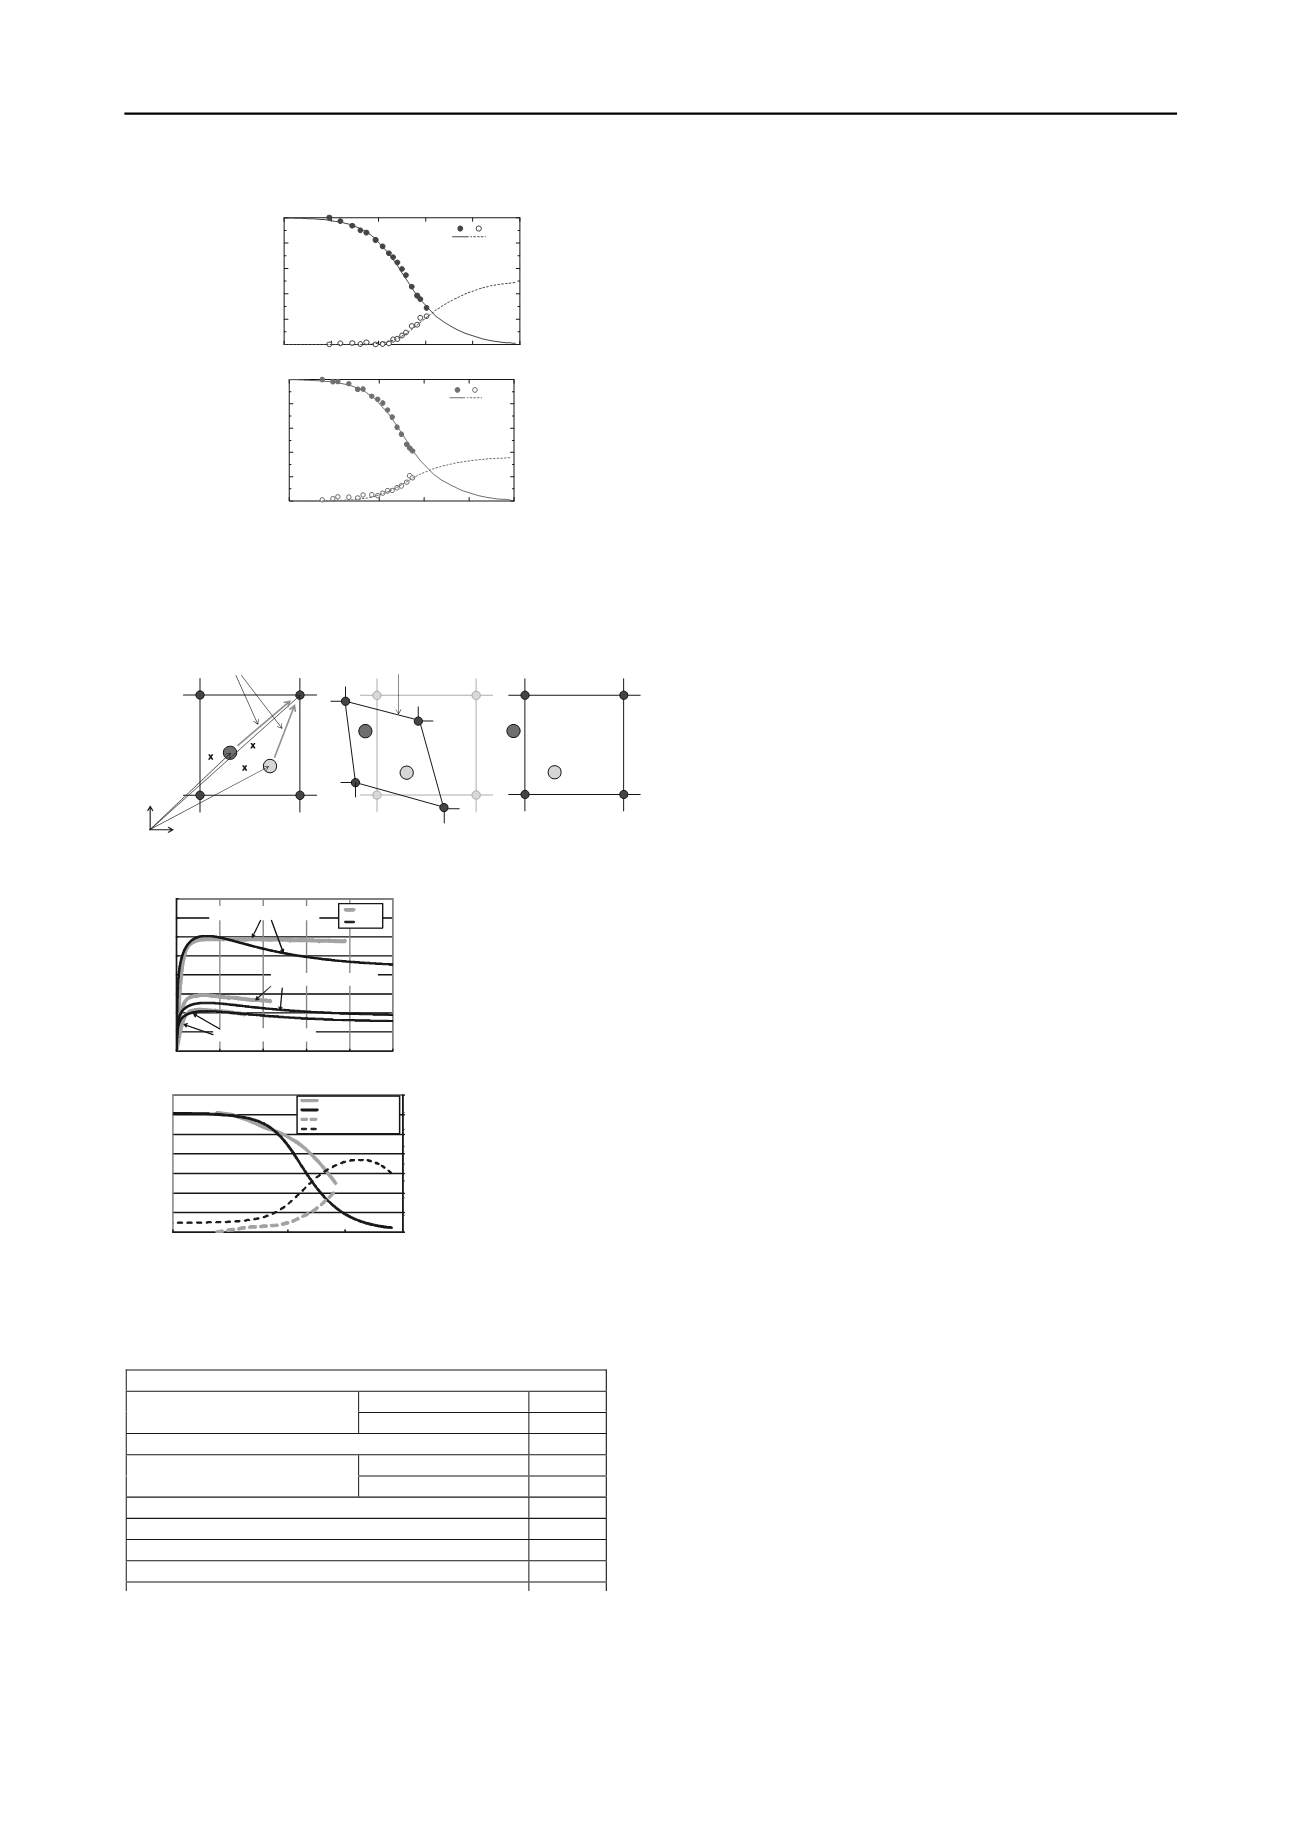
          (a) General part                                              (b) Reinforced part
        
        
          Figure 4. Results of investigation to determine the stress-strain
        
        
          characteristics of a material specimen under cyclic tri-axial tests using the
        
        
          GHE-S model
        
        
          y
        
        
          x
        
        
          x
        
        
          i
        
        
          x
        
        
          p1
        
        
          x
        
        
          p2
        
        
          (a)Formerstage
        
        
          (b)Conventionstage
        
        
          (c)Latterstage
        
        
          Transfer physical values of particles
        
        
          to nodes of background mesh
        
        
          Calculate strain of background mesh
        
        
          usingconservativeFEM approach
        
        
          Mesh is reset to the initial configuration,
        
        
          whiletheparticlekeepsthe position.
        
        
          Figure 5. Analysis flow of the MPM
        
        
          0.0
        
        
          20.0
        
        
          40.0
        
        
          60.0
        
        
          80.0
        
        
          100.0
        
        
          120.0
        
        
          140.0
        
        
          160.0
        
        
          0.0
        
        
          2.0
        
        
          4.0
        
        
          6.0
        
        
          8.0
        
        
          10.0
        
        
          D
        
        
          eviatoric
        
        
          stress
        
        
          (kP
        
        
          a)
        
        
          Axialstrain (%)
        
        
          Test
        
        
          Model
        
        
          Confining pressure= 50kPa
        
        
          Confining pressure=5kPa
        
        
          Confiningpressure =10kPa
        
        
          0
        
        
          5
        
        
          10
        
        
          15
        
        
          20
        
        
          25
        
        
          30
        
        
          35
        
        
          40
        
        
          0
        
        
          10
        
        
          20
        
        
          30
        
        
          40
        
        
          50
        
        
          60
        
        
          70
        
        
          0.0001
        
        
          0.0010
        
        
          0.0100
        
        
          0.1000
        
        
          1.0000
        
        
          D
        
        
          am
        
        
          ping
        
        
          ratio


            h


          (%
        
        
          )
        
        
          S
        
        
          hearm
        
        
          odulus


            G


          (M
        
        
          N
        
        
          /m
        
        
          2
        
        
          )
        
        
          Deviatoricstrain (%)
        
        
          Experiment (shear modulus)
        
        
          Analysis (shearmodulus)
        
        
          Experiment (damping ratio)
        
        
          Analysis (damping ratio)
        
        
          Confiningpressure= 10kPa
        
        
          Figure 6. Results of investigation to determine the stress-strain
        
        
          characteristics of a material specimen under tri-axial compression tests and
        
        
          cyclic tri-axial tests using the SYS Cam-clay model
        
        
          2) The similar failure patterns of one and three layered slope
        
        
          models to that seen at the shaking table test could be obtained
        
        
          by the MPM with the SYS Cam-clay model. However, the
        
        
          MPM analysis could not produce good agreements in the one
        
        
          layered slope model regarding the amount of deformation,
        
        
          which should be improved in the future work.
        
        
          3) Consequently, it is considered that the FEM analysis is
        
        
          appreciate for a slope with large amplification of response
        
        
          acceleration and the MPM analysis is appreciate for a slope
        
        
          with a weak layer as analytical tools for assessing seismic
        
        
          safety of slopes. However, both models should be improved
        
        
          to evaluate seismic behavior of slopes more accurately.