1404
Proceedings of the 18
th
International Conference on Soil Mechanics and Geotechnical Engineering, Paris 2013
compared to that of an irregular configuration obtained by
shifting square grids, thus preventing a straight flow passage of
liquefied soil. Shaking table tests on sloping ground and quay
wall models proved that the irregular pattern was more effective
in reducing residual displacements in the treated soil volume;
nevertheless, the ‘damming effect’ increased both downstream
deformation in the sloping ground (Fig. 18a) and pore pressure
in the treated backfill behind the quay wall (Fig. 18b).
0
20
40
60
80
100
120
140
160
Lateral displacement (mm)
-1200
△
:CASE1(No improvement)
●
:CASE2(Irregular 25%)
□
:CASE4(Regular 25%)
-1000-800 -600 -400 -200 0 200 400 600 800 1000 1200
Holizontal position (mm)
Improved area
0 10 20 30 40 50 60 70 80
0.0
0.2
0.4
0.6
0.8
1.0
Cumulative displacement of quay wall (mm)
Case6
Case8
Maximum excess pore water pressure ratio
:200Gal
:500Gal
Case7
(b)
(a)
irregular
regular
untreated
Figure 18. Lateral displacements and pore pressure buildup in shaking
table tests on sloping ground (a) and quay wall (b) with columnar
treatments (
N. Takahashi et al.
).
5 GROUND DEFORMATION AND SLOPE STABILITY
The paper by
Isobe & Ohtsuka
(Japan) reports a comprehensive
‘Study on long-term subsidence of soft clay due to 2007 Niigata
Prefecture Chuetsu-Oki Earthquake’ (M
w
=6.8). Pre-earthquake
long-term settlements due to groundwater pumping at
Kashiwazaki City were observed to significantly increase after
the event. An accurate field (SPT) and laboratory (oedometer
plus static and cyclic TX tests) investigation was carried out to
calibrate the mechanical parameters of three soft to medium
stiff clays, in order to carry out a coupled elasto-plastic FEM
analysis of a 50m deep layering. The simulation of the shaking
and post-earthquake behaviour allowed to predict pore water
pressure increase and dissipation (Fig. 19), resulting in a long-
term settlement as high as 25 cm in about 100 years.
0.00
0.05
0.10
0.15
0.20
0.25
0.30
0.35
0.40
45m
35m
25m
15m
5m
Excess Pore Water Pressure Ratio
Time
100 200 300
(sec)
(year)
1 30 60 90 120 150
Figure 19. Pore pressure buildup and dissipation predicted by elasto-
plastic simulation of earthquake-induced subsidence (
Isobe & Ohtsuka
).
Tsai et al.
(Taiwan-USA) propose a simplified procedure for
a slope stability ‘Pseudo static analysis considering strength
softening in saturated clays during earthquakes’. They update
and combine well-established approaches for estimation of the
shear strain amplitude and the equivalent number of uniform
strain cycles from the peak ground acceleration and other
seismological and site parameters. On such a basis, the strength
softening can be evaluated and implemented in post-earthquake
pseudo-static stability analysis. The method was applied to
predict the post-seismic reduction of safety in an embankment
at Berryman Reservoir (USA), as well as for the interpretation
of the observed damage induced by the 1999 Kocaeli
earthquake (Turkey) at the Carrefour shopping center, which
cannot be explained without a strength reduction (Fig. 20).
0
20
40
60
80
-20
-10
0
Depth (m)
NewFill,
=34
OldFill,
=34
ML/CL,PI=10,Su=25 kN/m 2
SM,PI=11,
=32
CH,PI=37,Su=35 kN/m 2
A
B
C
D
E
FS=3.0 (pre earthquake)
FS=1.3 (during earthquake, no strength reduction)
FS=1.0 (during earthquake, 15% strength reduction)
Distance (m)
Figure 20. Stability analyses at Carrefour shopping center (
Tsai et al.
).
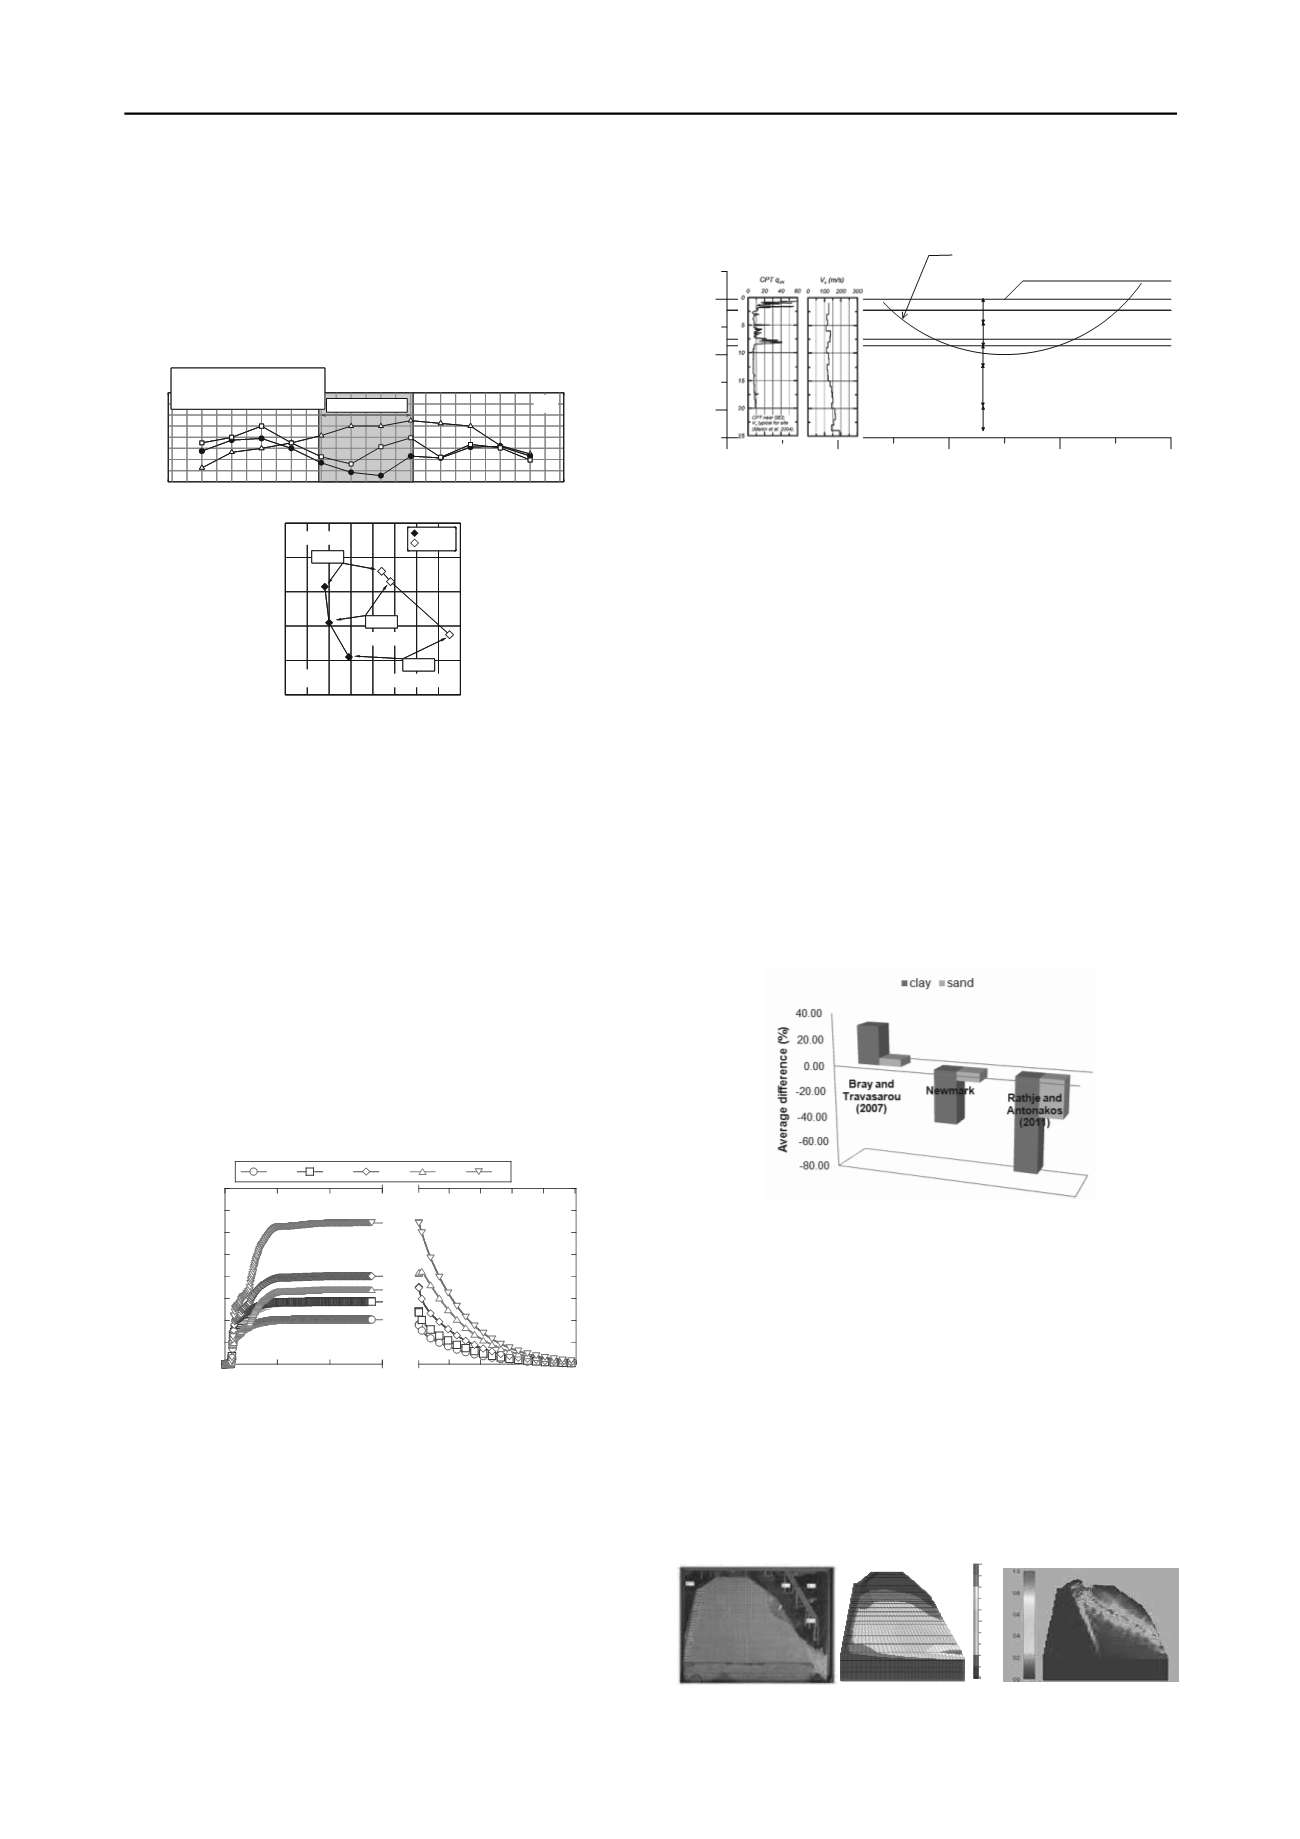
Fotopoulou & Pitilakis
(Greece) present a ‘Reliability
analysis of empirical predictive models for earthquake-induced
sliding displacements of slopes’, comparing the predictions of:
- the coupled Bray & Travasarou (2007) stick-slip model
(B&T), based on a single ground motion parameter, i.e.
S
a
(1.5T
S
), being T
S
the degraded soil natural period;
- the decoupled Rathje & Antonakos (2011) model (R&A),
based on two ground motion parameters (PGA, PGV or their
equivalent values for soft slopes);
- the classical Newmark (1965) rigid block model (N).
The Authors assumed as reference displacements the results
of 2D elasto-plastic FDM analyses for ideal sand and clayey
slopes, with different accelerograms as input motion. It was
verified that the approximation increased with the degree of
definition of the input motion, being the B&T model (1
parameter) conservative, but with more dispersion, while the
R&A (2 parameters) and the N (full time history) models under-
predicted, although with less scatter, the FDM results (Fig. 21).
Also, the reliability seemed overall better for the sand slopes.
Such interesting benchmark claims for further comparisons on
well-documented case studies.
Figure 21. Median displacements predicted with simplified models vs.
the corresponding FDM results (
Fotopoulou & Pitilakis
).
Abe et al.
(Japan) present an ‘Analytical study of seismic
slope behavior in a large-scale shaking table model test using
FEM and MPM’, investigating on two steep model slopes
constituted by sand-bentonite mixtures. A homogenous and a
layered model with a weak sloping layer were shaken with
irregular or regular time histories, showing rotational or planar
failure mechanisms, respectively. Blind numerical predictions
of the former model test by nonlinear multiple spring FEM
analysis could not capture the observed failure mechanism (Fig.
22 a-b), which was conversely well-predicted by the Material
Point Method (MPM), able to simulate progressive failure due
to strain-softening (Fig. 22c). The latter approach was also
effective to predict the observed shear failure mechanism and
displacements exhibited by the layered model.
0.0
0.005
0.011
0.017
0.022
0.028
0.033
0.039
0.044
0.050
0.055
(a)
(b)
(c)
Figure 22. Observed failure (a) and contours of maximum shear strain
predicted by FEM (b) and MPM (c) analyses (
Abe et al.
).


