1394
Proceedings of the 18
th
International Conference on Soil Mechanics and Geotechnical Engineering, Paris 2013
Paper #2337 (Shimizu and Yamada) discusses the effect of
seismic waves on the delayed failure behaviour of earth works.
The natural frequencies and natural modes of the whole soil
structure-ground system are calculated first. The embankment is
then assumed to be saturated and elasto-plastic finite elements
represent the two-phase soil-water media to simulate the whole
consolidation process. For the constitutive equation for the soil
skeleton, the elasto-plastic constitutive equation “SYS Cam-
clay model” is considered for the ground and an embankment
constructed on it (soil-water 2-phase system). Seismic response
analyses, in frequency bands close to the natural frequencies of
the structure-ground system, are carried out. Various delayed
failure behaviours are found: they may develop from the ground
to the embankment (case 1, Fig.8) or from the embankment to
the ground.
2) End of earthquake
3) 21h after earthquake
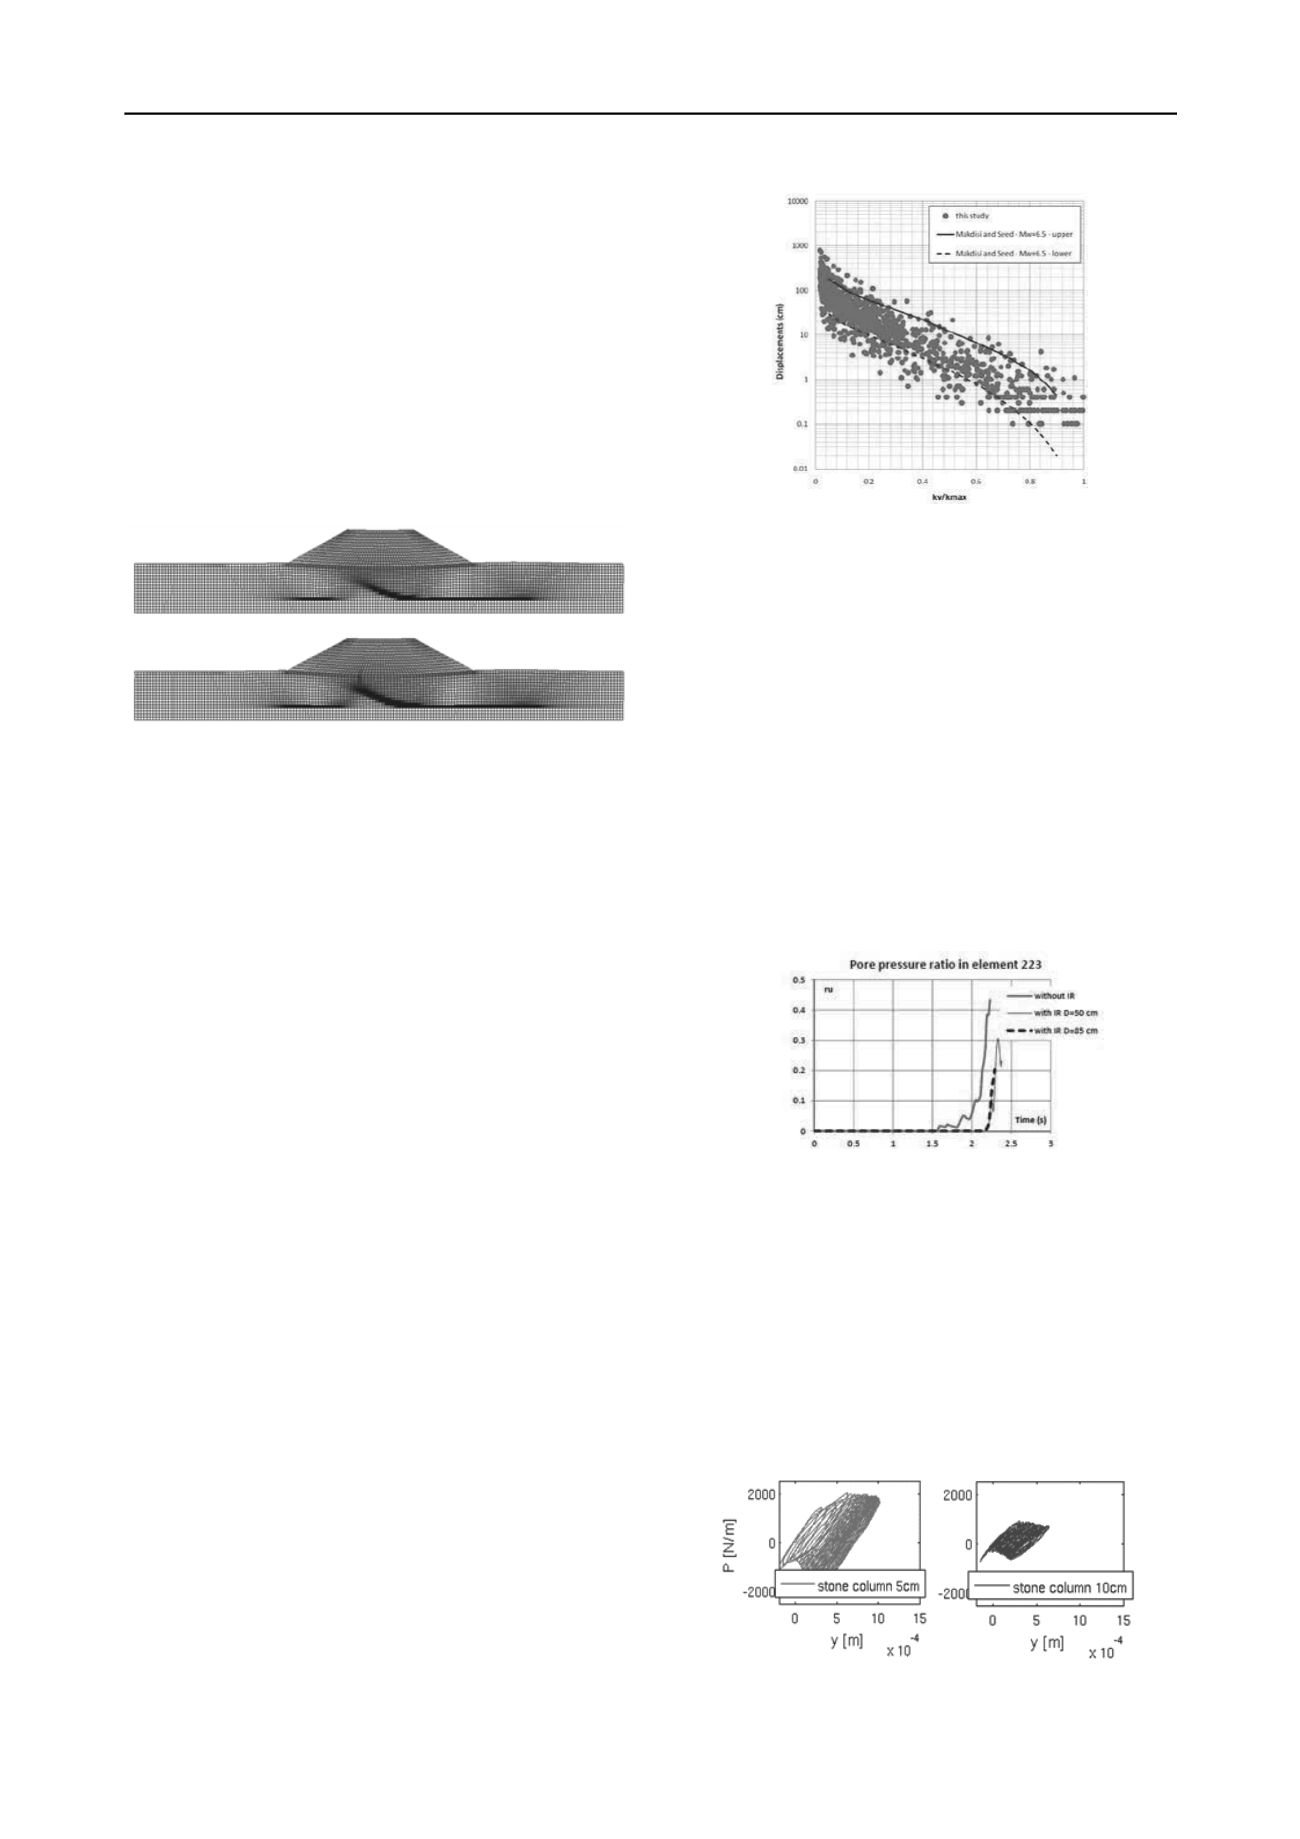
Figure 8: Slip surface (case 1) developing from ground to embankment
(Shimizu, 2337).
The structural stability of an earth dam is also investigated
by Srivastava and Babu (paper #2571). In this work, a
geosynthetics lining system is used as a seepage barrier. The
static and dynamic stability of the dam is studied numerically. A
dynamic numerical analysis is also performed considering a
sinusoidal excitation as well as Bhuj earthquake recordings. The
results clearly show that geosynthetics lining system enhance
the stability of the dam sections. In the static case, the factor of
safety is increased 1.45 times. In the dynamic case, the
maximum displacement at the dam crest is only one third of that
of the case where there is no geosynthetics. It is due to the
strong reduction of the excess pope water pressure.
In paper #2751, Athanasopoulos-Zekkos and Seed perform
dynamic 2D equivalent linear, finite element numerical analyses
to obtain accelerations and shear stresses for three levee profiles
in California. Four sliding surfaces are pre-selected based on
previous slope stability analyses for identifying the most critical
sliding surfaces, and the seismically induced deviatoric
displacements are computed using a Newmark-type approach.
As suggested by Seed and Martin (1966), the effects of the
dynamic response of the sliding mass itself can be significant in
the overall displacements. Therefore, the concept of the
equivalent acceleration time history is used to account for this
effect. 1,500 ground motions (from the Pacific Earthquake
Engineering Research Center, NGA strong motion database) are
used to develop statistically stable estimates of dynamic
response of the levees and to provide insight towards the effect
of ground motion selection to the dynamic response of earthen
levees. Four groups of input ground motions were used in the
analyses, each group scaled to a specified PGA
input
: 0.1g, 0.2,
0.3g, and 0.4g respectively.The magnitude of the seismically
induced displacements depend on the seismic resistance of the
earth embankment (k
y
) and the seismic demand (k
max
). Figure 9
shows the calculated displacements increase for a given k
y
/k
max
ratio and for PGA
input
=0.2g. They are between the two bounds
proposed by Makdisi and Seed (1978), but still closer to the
lower bound curve. This provides an important insight as to
how to interpret these bounds for different shaking intensities,
within the same magnitude bin. From these results,
recommendations are made on evaluating seismically-induced
deviatoric displacements for levees.
Figure 9. Seismic displacements for motions with M
w
=6.5 to 7.0 and
PGA
input
=0.2g, for Levee A (Athanasopoulos-Zekkos and Seed, #2751).
6 IMPROVEMENT
Four papers are dedicated to soil improvement to reduce
liquefaction.
Zerfa (paper #1745) models the behaviour of reinforced
ground by the finite element method in 2D considering a Bowen
mixture formulation. Prevost’s model is used for the soil
behaviour (saturated porous medium) and the stiff columns
embedded in the soil are considered as elastic. Lysmer type
absorbing boundaries are implemented. The dynamic
simulations involve a Pacoima type accelerogram (PGA limited
to 0.25g). As displayed in Fig.10, the pore pressure build up is
significantly faster in the unreinforced soil. However, the
numerical results show that a large replacement area is
mandatory to mitigate liquefaction, reduce pore pressures and
settlements between columns.
Figure 10. Pore pressure ratio with and without stiff columns (Zerfa,
#1745).
In paper #1878, Lambert investigates the response of Mixed
Module Columns (CMM®s) to different static and dynamic
loads through in situ and laboratory tests (shallow foundation
with a group of Mixed Columns). The field tests indicate that
the bearing capacity is three time larger than that of the original
soil and the settlements are found to be 4 to 5 times less. A
reduced scale model is also studied through 1g laboratory
experiments. The influence of the thickness of the soft part of
the Mixed Column of the forces recorded in the stiff part is
displayed in Fig.11 as the lateral pressure of the soil p with
respect to the lateral displacement of the head of the rigid part,
denoted y.
Figure 11. p-y curves at the rigid part head for 5 and 10 cm gravel
column (Lambert, #1878).


