1384
Proceedings of the 18
th
International Conference on Soil Mechanics and Geotechnical Engineering, Paris 2013
A nonwoven geotextile served as a separation layer in
conjunction with a triangular aperture geogrid below the
aggregate layer. Based on our understanding of the site
subgrade soils and overlying pit-run aggregate, a nonwoven
geotextile was recommended for use as a separation layer.
11.3
6.3
59.6
33.2
0
20
40
60
80
100
120
0.9 meter from CL
1.0 meter from CL
Subgrade
Stress (kPa)
Stabilised Section Unstabilised Section
Table 3. Summary of geosynthetic treatments.
Type
Physical Properties
Polypropylene triangular aperture
geogrid
Radial Stiffness =
300 kN/m @0.5% strain
Polypropylene nonwoven geotextile
Weight = 8oz/yd
2
3.3 Test section construction
Four test sections were tested during this field study. All test
sections consisted of a 300mm thick layer of pit run materials
placed over the subgrade. Two sections are stabilised by a layer
of geogrid placed at the interface between the subgrade and pit
run material. Each test section was approximately 7 metre wide
by 10 metres in length. Two EPCs were placed in each test
section subgrade to monitor horizontal stress in the subgrade. In
general, the approximate angle of distribution of stress within a
properly designed geogrid stabilised section is 45 degrees.
Therefore, EPCs were placed at 0.9 metre and 1.0 metre from
the edge of the wheel path. Pit runmaterial was placed on top of
the geogrid by a CAT D8 dozer in a 900mm thick lift. After
placement of pit run material, lines were painted on the surface
of the road at 0.3 metre intervals from the centerline within the
areas over the pressure plates.
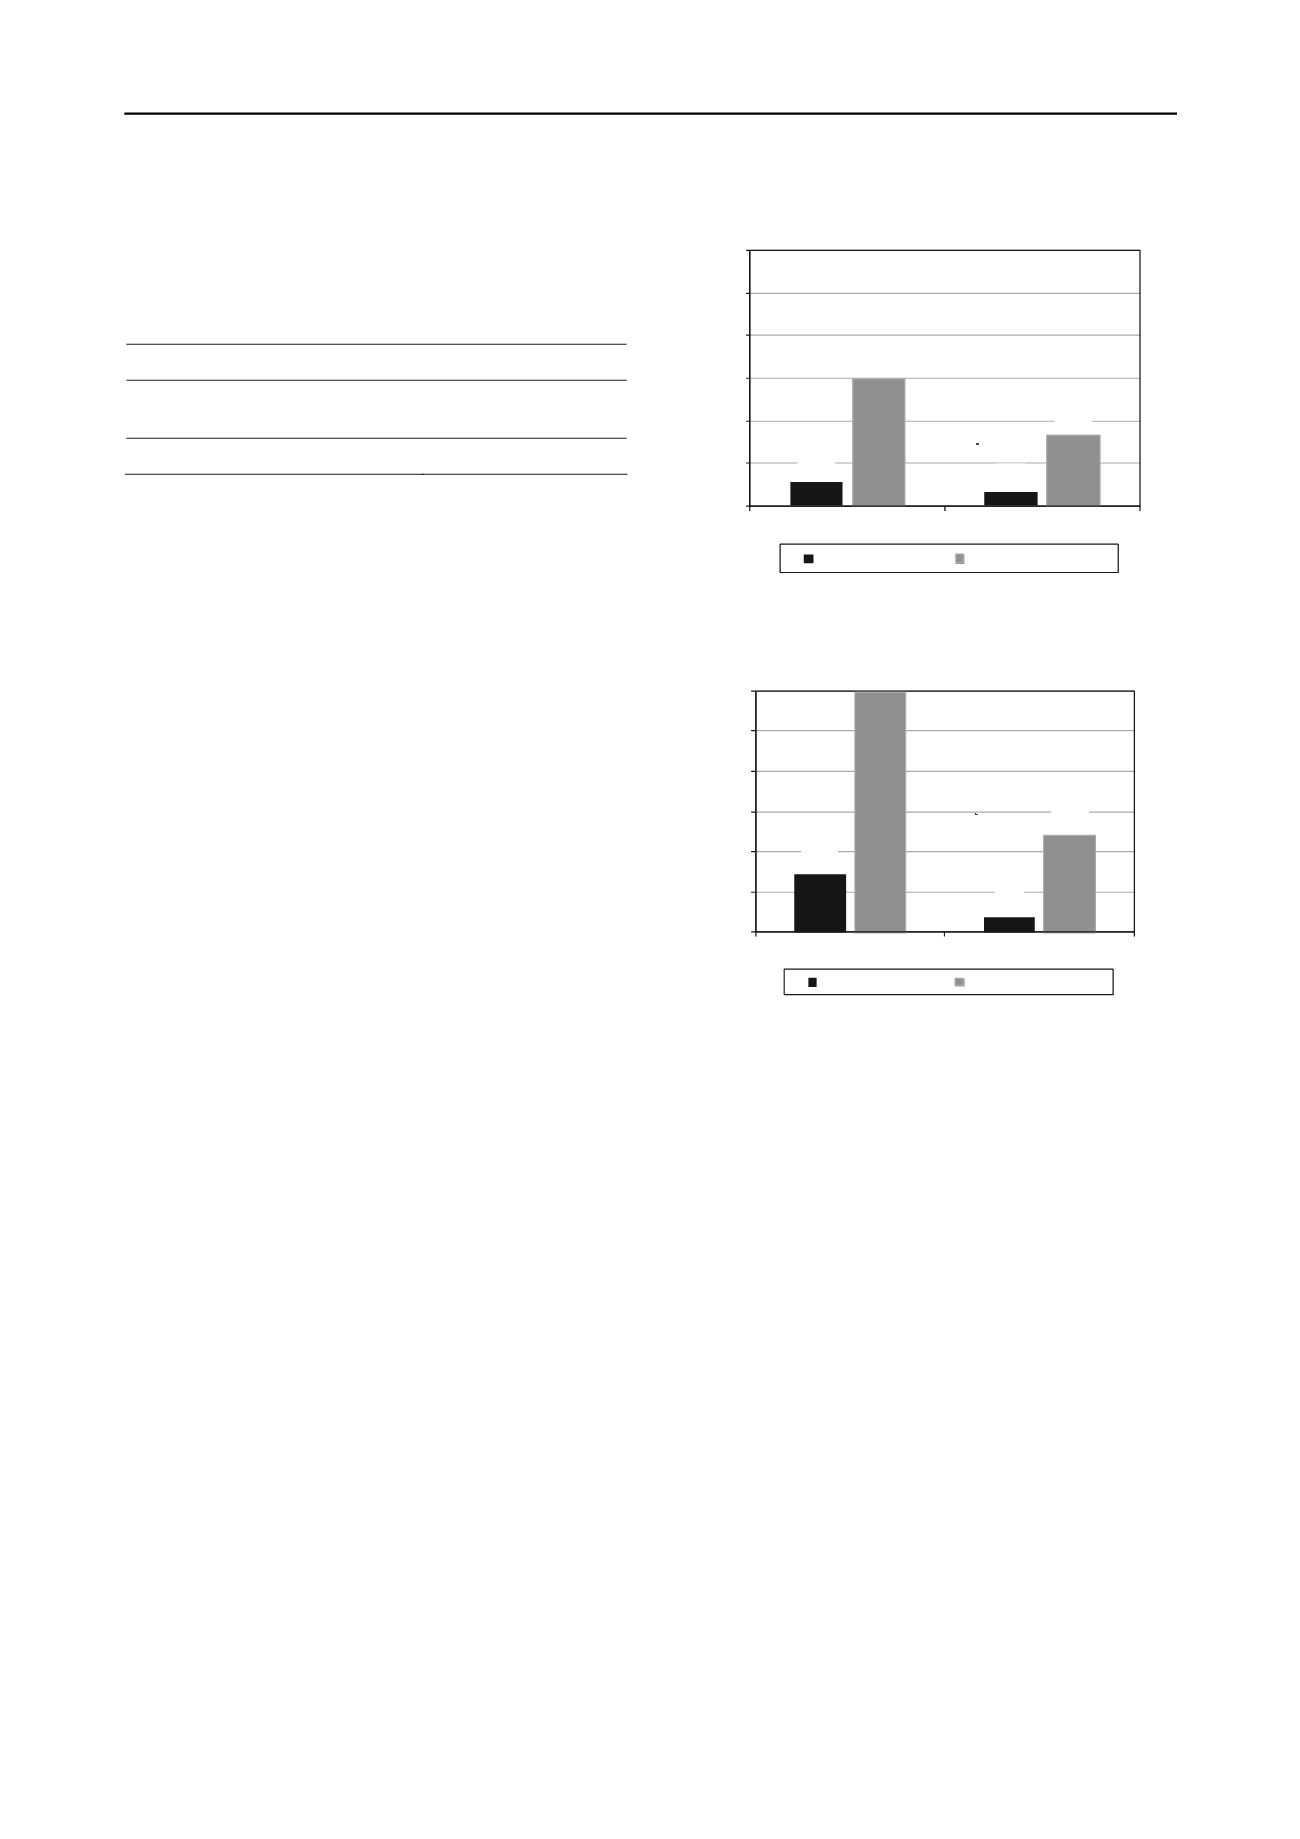
Figure 7. Subgrade pressures of 900mm sections.
28.6
7.6
119.2
48.0
0
20
40
60
80
100
120
0.9 meter from CL
1.0 meter from CL
Subgrade
Stress (kPa)
Stabilised Section Unstabilised Section
3.4 Results
Test sections were trafficked by a Volvo A40F articulated truck.
The loaded truck produces a ground contact pressure of 176 kPa
under each wheel. There was some surface movement of the fill
material (due to the smooth rounded aggregate), but no
significant deformation of the section was noticed within the
wheel path over the course of 50 passes.
Figure 8. Subgrade pressures of 600mm sections.
The stresses as presented represent the change in ground
stresses under the accumulated trafficking passes. As expected,
higher stresses are recorded within the control section. Stress
measurements in Figure 7 indicate that the stresses of the
control section were in the range of 33 to 60 kPa depending
upon the distance from wheel path. The stresses of triangular
aperture geogrid stabilised section were in the range of 6 to
11 kPa.
4 CONCLUSIONS
The other two sections (control and stabilised) were lightly
trafficked. As no significant surface deformation was noticed
within 23 passes, sections were then cut down from 900mm in
height to 600mm by a CAT 980H loader.
Traffic resumed post-cut. Significant deformation occurred
after the first pass across the control section. The trafficking
was stopped after 1 additional pass. There was no indication of
structural distress in the stabilised section. Stress measurements
taken from the first pass are shown in Figure 8. The results
indicate that the stresses of the control section were in the range
of 48 to 120 kPa, whereas the stresses within the stabilised
section were in the range of 8 to 29 kPa.
The field tests have demonstrated benefits in terms of a
dramatic reduction in subgrade stress. Rut depth measurements
showed all geogrid stabilised sections performed significantly
better than the unstabilised controls. In-ground stress cell
measurements showed that higher horizontal stress developed
within the stabilised aggregate layer during compaction and this
was maintained throughout trafficking. The stabilisation ratio
calculated as the ratio of horizontal stresses in the base and
subgrade layers provides an indication of field trafficking
performance. Results of the second study validate the
performance of the triangular aperture geogrid examined in two
full scale trafficking studies.
5 REFERENCES
After the trafficking test was completed, trenches were
excavated to observe subgrade conditions. A significant amount
of intermixing of the pit run material and subgrade interface
occured within the 600mm thick control section. Very little
intermixing of the subgrade materials was observed in all other
sections including the 600mm thick triangular aperture geogrid
stabilised section.
Tingle, J.S. and Webster, S.L. 2003. Review of Corps of Engineers
Design of Geosynthetc Reinforced Unpaved Roads,
Annual meeting
CD-ROM, TRB
, Washington, D.C.
Rao, C., Tutumluer, E., and Kim, I-T. 2002 Quantification of Coarse
Aggregate Angularity based on Image Analysis. Transportation
Research Record (TRB) No. 1787, 117-124,.
Rao, C., Pan, T., and Tutumluer, E. 2003. Determination of Coarse
Aggregate Surface Texture Using Imaging Analysis. In Proceedings
of the 16th ASCE Engineering Mechanics Conference
White, D.J., Vennapusa, P.K.R., Gieselman, H.H., Douglas, S.C.,
Zhang, J. and Wayne, M.H. 2011. In-Ground Dynamic Stress
Measurements for Geosynthetic Reinforced Subgrade/Subbase.
Geo-Frontiers
, Dallas, Texas.


