 
          1379
        
        
          Technical Committee 202 /


            Comité technique 202


          interest. As the construction of the motorway takes some month
        
        
          it is not necessary to describe the curvature of the time-
        
        
          dependent deformation, which is observed during the first
        
        
          period.
        
        
          According to figure 4, the deformation characteristics after
        
        
          approximately 100 days may be described by a creep law given
        
        
          by Buisman 1939. This law was originally developed to
        
        
          describe the creep following consolidation of clays after a
        
        
          stepwise increase in effective stresses. In addition it is suitable
        
        
          to describe the deformation characteristic of the dump mainly
        
        
          made up of unsaturated coarse-grained sandy soils. The creep
        
        
          law demands two model parameters, a reference time (defined
        
        
          as the time when the deformation starts) and the magnitude of
        
        
          creep deformation. The deformation rate characterized by the
        
        
          slope in a semi-logarithmic time vs. deformation plot as given
        
        
          in figure 4 is described by the parameter C
        
        
          K
        
        
          in analogy to the
        
        
          parameter C
        
        
          B
        
        
          given in the original work of Buisman 1936 (“K”
        
        
          represents the German word “Kippe” meaning “dump”).
        
        
          In figure 5, the parameter C
        
        
          K
        
        
          derived from the time
        
        
          dependent deformation curve of the survey points along the
        
        
          alignment of the planned A 44 autobahn is plotted. C
        
        
          K
        
        
          was
        
        
          evaluated from the slope of the deformation characteristics for a
        
        
          period of 1 year after the completion of dumping until mid
        
        
          2011.
        
        
          4000
        
        
          4500
        
        
          5000
        
        
          5500
        
        
          6000
        
        
          6500
        
        
          7000


            Station [m]


          0.00
        
        
          0.05
        
        
          0.10
        
        
          0.15
        
        
          0.20
        
        
          analyzed from 365 days on after
        
        
          completion of the dumping process


            Parameter C


            K


            [%]


          south
        
        
          north
        
        
          dumping process
        
        
          Figure 5. Parameter C
        
        
          K
        
        
          along the A 44 autobahn route
        
        
          The plot in figure 5 gives a very uniform distribution of the
        
        
          parameter C
        
        
          K
        
        
          in between the station 4500 m and 6800 m of the
        
        
          A 44 route. C
        
        
          K
        
        
          varies in between 0.075 % and 0.125 % with a
        
        
          mean value of roughly 0.1 %. Only some points around 6700 m
        
        
          give smaller values of C
        
        
          K
        
        
          . Analyses of the data show that the
        
        
          depth of the dump along the observed survey points has no
        
        
          effect on the parameter C
        
        
          K
        
        
          . Nevertheless the depth of the dump
        
        
          within the area that can be observed until now changes from in
        
        
          the south 135 m to 155 m in the north.
        
        
          In the future the dumping process will advance another 3 km
        
        
          to the north creating depths of dump up to 185 m. The shown
        
        
          geodetic measurements provide data for determining time
        
        
          dependent deformations. Therefore, special care is required in
        
        
          the evaluation of geodetic data on a continuous basis to verify
        
        
          that the values of C
        
        
          K
        
        
          will change in the northern region because
        
        
          of an increasing depth of dump. In the event the dumping
        
        
          concept described in chapter 2 is carried out until the dump
        
        
          beneath the A 44 alignment is completed, the measured C
        
        
          K
        
        
          of
        
        
          0.1 % will provide valuable information for the prediction of
        
        
          deformations.
        
        
          3.2


            Effect of initial density on the time-dependent behaviour


          The stress and time-dependent deformation behaviour of the
        
        
          soils was investigated using one-dimensional compression tests.
        
        
          Four different soils representing the majority of the curves
        
        
          plotted in figure 3 were chosen. In different test series the effect
        
        
          of varying initial density and loading rate on the time-dependent
        
        
          compression were examined in detail. Additionally, soaking at
        
        
          different stresses was evaluated.
        
        
          All tests were carried out by increasing the stress stepwise
        
        
          while observing the axial deformation of the sample. Within the
        
        
          first few seconds after the stress was applied, comparatively
        
        
          large strains were measured. The following strains reduce
        
        
          rapidly with elapsed time. This characteristic can be described
        
        
          by drawing a straight line in a diagram plotting strain versus
        
        
          natural logarithmic time (see figure 6). The slope of the straight
        
        
          line can be expressed by the Buisman constant C
        
        
          B
        
        
          (Buisman
        
        
          1936).
        
        
          time t


          = C
        
        
          B
        
        
          ·ln(t/t
        
        
          0
        
        
          )
        
        
          strain


          [%]
        
        
          logarithmic
        
        
          (base 2,718)
        
        
          t
        
        
          0


          0


          t0


          ti
        
        
          t
        
        
          0
        
        
          t
        
        
          i
        
        
          t
        
        
          i
        
        
          time t
        
        
          strain


          [%]
        
        
          stepwise increase
        
        
          of stress
        
        
          Figure 6. Time-dependent deformation after a stepwise stress increase
        
        
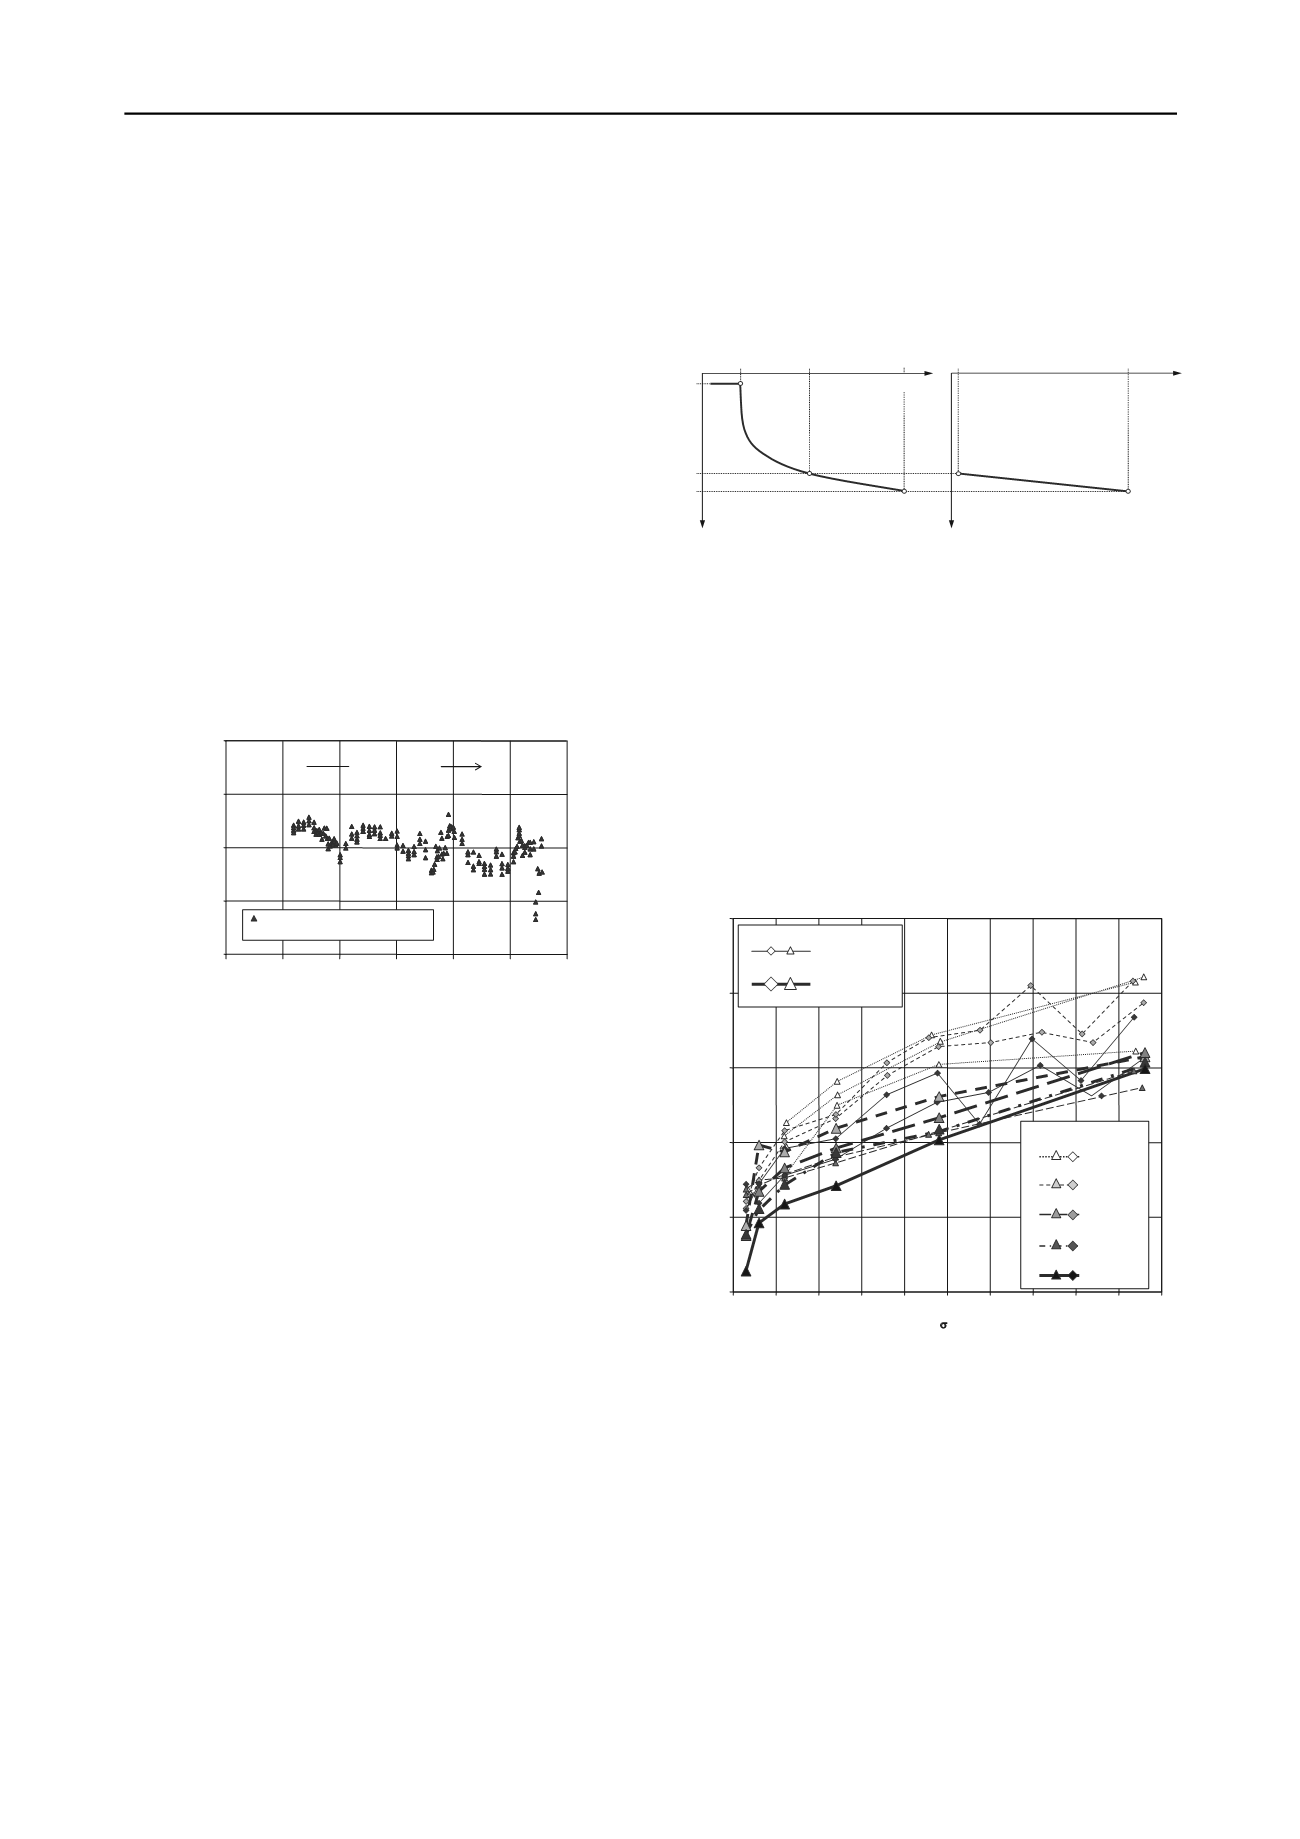
          Figure 7 illustrates the values of C
        
        
          B
        
        
          determined for a silty
        
        
          fine sand with a content of fines of 15 mass-%. The samples had
        
        
          heights of 2 cm and 10 cm with respective diameters of 10 cm
        
        
          and 30 cm. Different initial densities with density indices I
        
        
          D
        
        
          = 0
        
        
          to 0.8 were examined. The initial water content was about 10 %
        
        
          for all tests. The tests show a clear dependence of the Buisman
        
        
          constant on the initial compaction index and governing stress.
        
        
          C
        
        
          B
        
        
          increases clearly with increasing stress. On comparing the
        
        
          results for different relative densities it can be seen that the C
        
        
          B
        
        
          value decreases with increasing density. On analysing all tests
        
        
          carried out on 4 soils samples, no significant influence of the
        
        
          soil type was recognized. Only a slightly higher C
        
        
          B
        
        
          value was
        
        
          determined for the silty sand (see figure 7) having a fines
        
        
          content of 15 mass-% opposed to the other investigated soils for
        
        
          which the fines content varies between 3 and 6 mass-%.
        
        
          0
        
        
          250 500 750 1000 1250 1500 1750 2000 2250 2500


            Parameter C


            B


            [%]


            Stress


            z


            [kN/m ]


            2


          0.00
        
        
          0.02
        
        
          0.04
        
        
          0.06
        
        
          0.08
        
        
          0.10
        
        
          Dimensions of the soil sample
        
        
          height = 2 cm
        
        
          diameter = 10 cm
        
        
          height = 10 cm
        
        
          diameter = 30 cm
        
        
          Initial relative density I
        
        
          D
        
        
          I
        
        
          D
        
        
          ≈ 0,2
        
        
          I
        
        
          D
        
        
          ≈ 0,4
        
        
          I
        
        
          D
        
        
          ≈ 0,6
        
        
          I
        
        
          D
        
        
          ≈ 0,8
        
        
          I
        
        
          D
        
        
          ≈ 0,0
        
        
          Figure 7. Influence of the initial relative density I
        
        
          D
        
        
          on the Parameter C
        
        
          B
        
        
          for a fine sand from the Garzweiler dump (silt and clay = 15 mass-%)
        
        
          4
        
        
          PREDICTION OF TIME-DEPENDENT
        
        
          DEFORMATIONS
        
        
          To predict the future time-dependent deformation of the
        
        
          dump especially regarding the areas along the A 44 route that
        
        
          are not yet filled up, the validation of a model based on a soil
        
        
          mechanic theory was necessary. As a reference date for the
        
        
          model used, the completion of dumping was set to the 1.1.2017.
        
        
          The information seen in figure 8 was calculated using two basic
        
        
          equations describing the stress and time-dependent deformation.
        
        
          This simple model only allows the calculation of a one-
        
        
          dimensional deformation. On expanding the model for
        
        
          predicting more complex dumping processes (e.g. simulating
        
        
          unloading and reloading) within a three-dimensional geometry,