1382
Proceedings of the 18
th
International Conference on Soil Mechanics and Geotechnical Engineering, Paris 2013
calculated bearing capacity factor of the geogrid stabilised
section was more than double that of the unstabilised section.
This paper presents the in-ground stress cell measurements
from two full-scale field tests to validate the enhanced
confinement effect associated with use of an integrally formed
punched and drawn geogrid.
2 FIELD STUDY 1 - WEIRTON, WEST VIRGINIA, USA
2.1 Research background
A field study at a site located in Weirton, West Virginiawas
developed to evaluate the support conditions of a mechanically
stabilised crushed limestone layer on soft clayey subgrade
(White et al. 2011). In-ground piezoelectric earth pressure cells
(EPC) were used to measure horizontal stress below and above
the geogrid location versus the passage of construction and
truck traffic over the course of test pad construction and
trafficking.
Goals of this field investigation were to:
-
Validate fitness for use of geosynthetic products in a
challenging subgrade improvement application for
construction and trafficking of an unpaved road.
-
Verify the enhanced confinement effect associated with the
use of geogrid due to geogrid-aggregate interlock.
-
Verify the degree of load spreading by recording lateral
stresses within the subgrade.
2.2 Test section construction
The subgrade soils beneath the test tracks were excavated to a
depth of 900mm below the surface. The excavated material was
replaced with a uniform lean clay (CL) material. The clay
material was placed in the test tracks in uniform 0.35 metre
thick loose lifts and mixed thoroughly to a uniform consistency
with a roto-tiller. Water was added and several passes of the
tiller were used to arrive at a moisture content that produced a
subgrade California Bearing Ratio (CBR) of approximately 2 to
3 %.
Geogrids were installed on top of a finished subgrade.
Physical properties of geogrid are summarized in Table 1.
Table 1. Summary of geosynthetic treatments.
Type
Physical Properties
Polypropylene
triangular
aperture geogrid
Radial Stiffness = 300 kN/m
@0.5% strain
Vertical and horizontal stress measurements were taken in
the subgrade and about 150mm above geogrid/base material.
Figure 1 illustrates the layout for horizontal and vertical stress
cells.
Figure 1. Cross Section of instrumentation installation.
Then, a base course aggregate (Ohio Department of
Transportation 304, base course material) was placed in two
compacted 300mm lift thicknesses. The crushed limestone was
classified as a GP-GM with about 8 percent of fines passing the
No. 200 sieve.
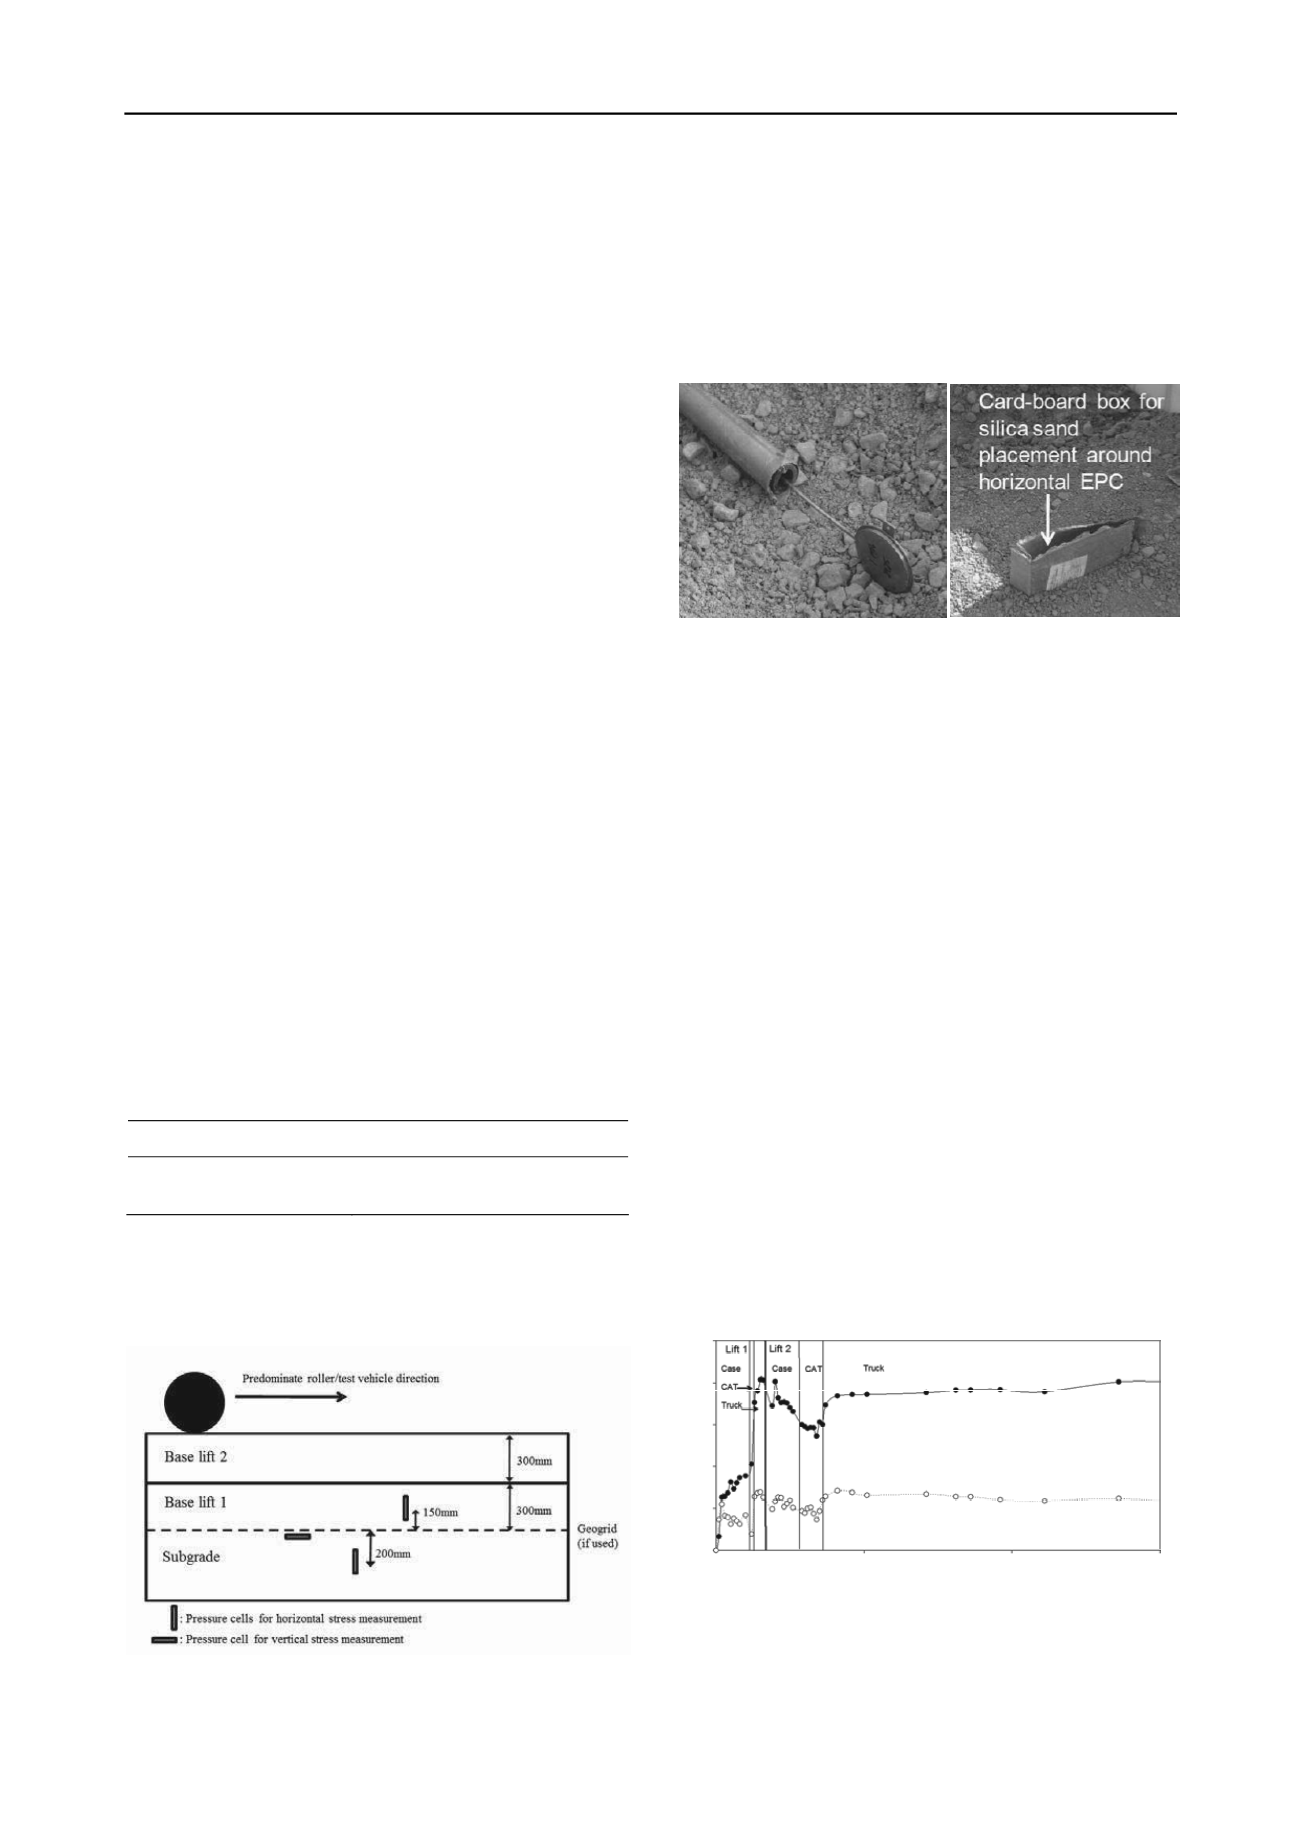
Cardboard is used as a temporary liner to contain the silica
sand backfill around the EPC (See Figure 2). Use of the sand
ensured a uniform stress was applied to the EPC surface.
Figure 2. Placing horizontal earth pressure cell at the bottom of the base
layer.
2.3 Results.
A Ford L8000 dump truck was used for trafficking of the
constructed test sections. The vehicle was loaded to a gross
vehicle weight of 18,370 kg.
Figure 3 depicts the readings of dynamic horizontal stresses
within the subgrade versus the passage of construction and truck
traffic over the course of test pad construction and trafficking.
Evident within Figure 3, is the minimal amount of horizontal
post traffic stress remaining within the subgrade in comparison
to the level found in the control section. The lateral stress below
the geogrid is a little over 5 kPa versus 20 kPa for the control
test section. This equates to a stress state value that is 25% of
the control stress state thus indicating a high level of subgrade
protection. This work demonstrated an enhanced fully confined
zone above the geogrid resulting in uniform vertical stress
across the subgrade resulting in less lateral stress.
Figure 4 depicts the horizontal stress state, post trafficking,
exhibited above geogrid. In contrast to the control, the geogrid
confines the unbound aggregate leading to an increased lateral
stress within the aggregate. The results demonstrate the
inclusion of geogrid at the interface of soft subgrade and
aggregate layers affects the development of the “locked-in”
horizontal stress following loading. A higher horizontal stress
within the stabilised aggregate layer gives a direct indication of
the lateral restraint mechanism. The result of increased
aggregate stresses leads to an increase in the resilient modulus
of aggregate adjacent to the geogrid.
25
20
15
10
5
0
50 100 150
Unstabilised section
Stabilised section
Roller/Test cumulative pass count
Stress (kPa)
Figure 3. Horizontal stress within the subgrade layer after roller
compaction and test vehicle passes (White, et. al., 2011)
.


