1383
Technical Committee 202 /
Comité technique 202
25
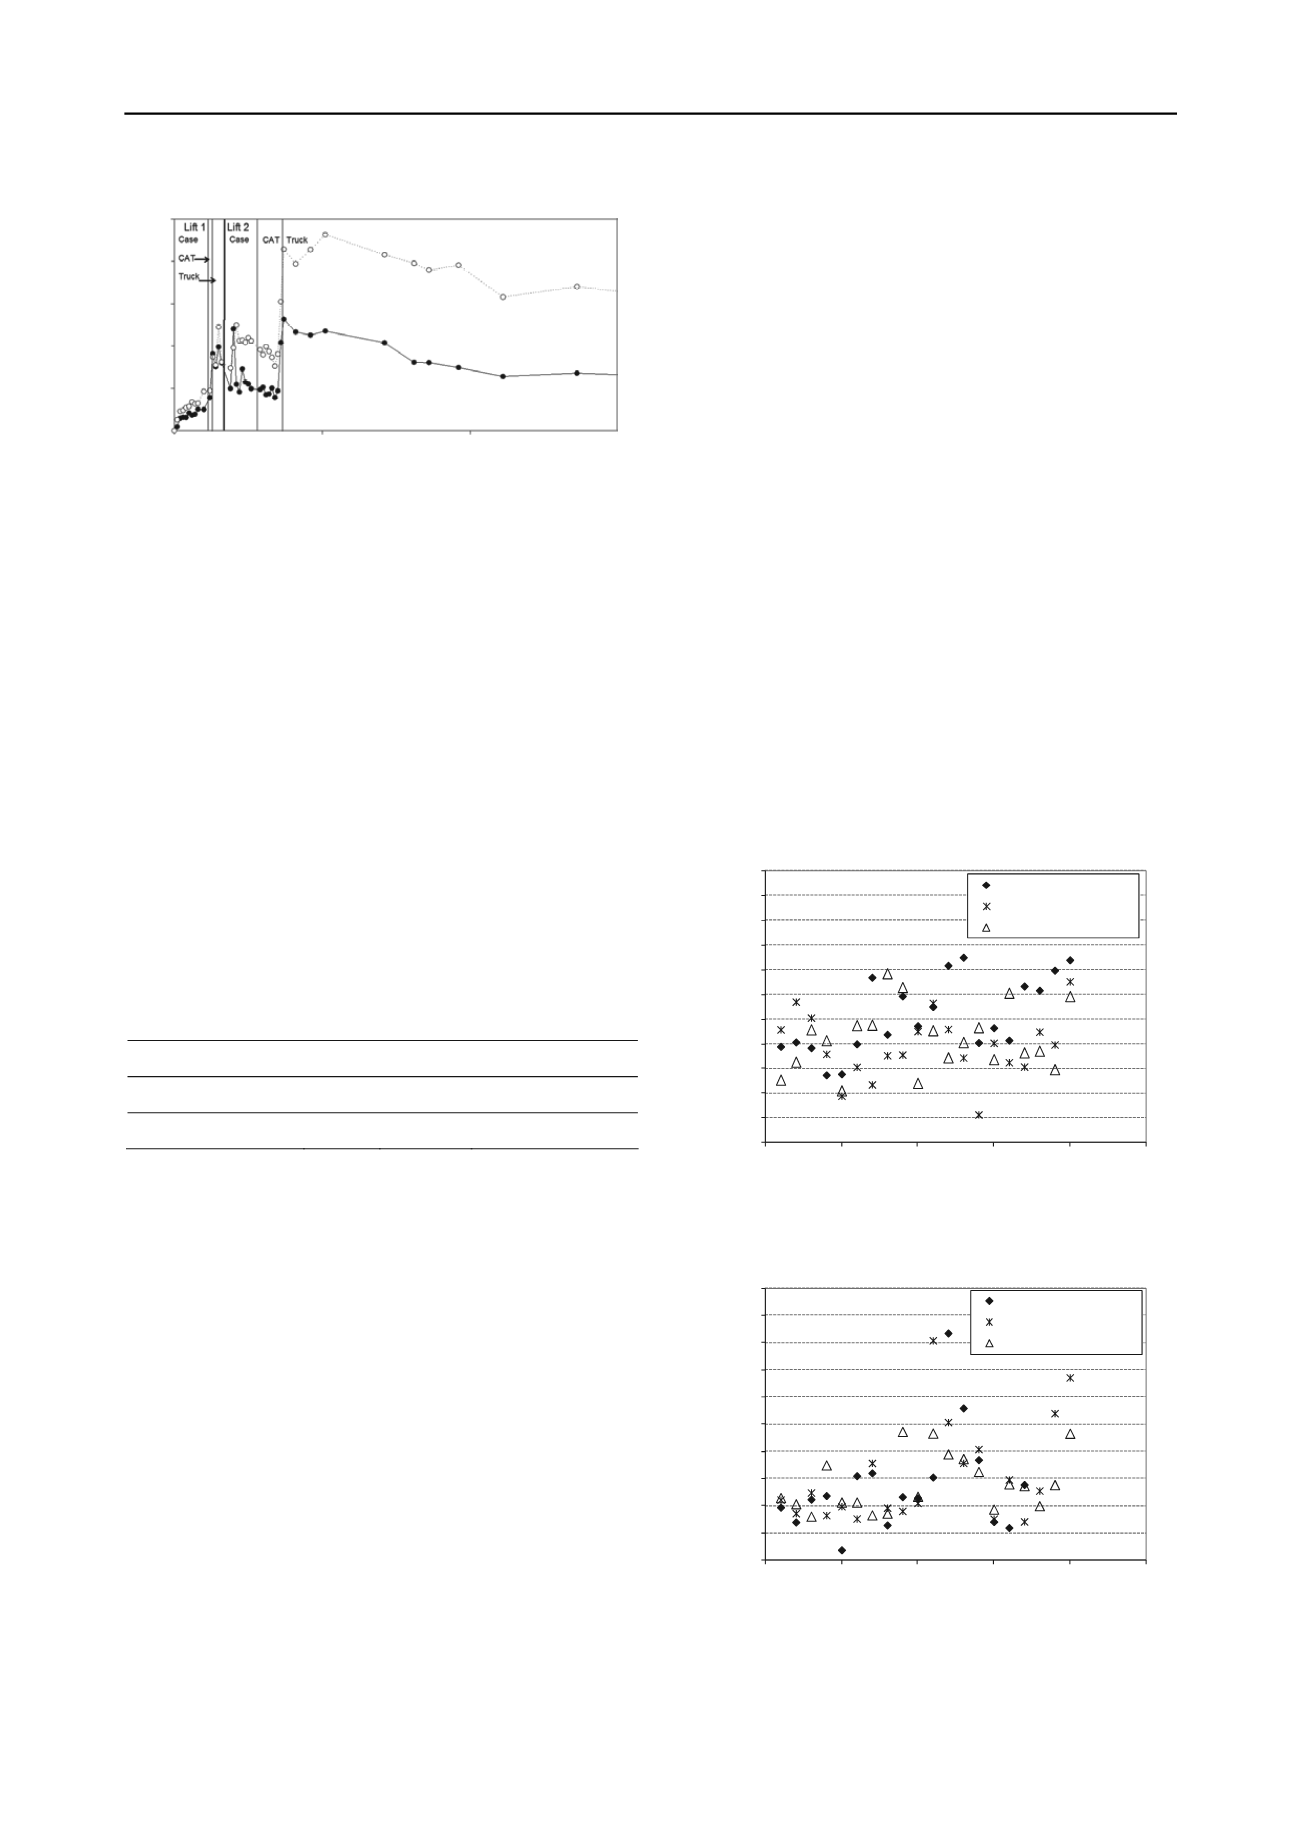
20
15
10
5
0
50 100 150
Unstabilised section
Stabilised section
Roller/Test cumulative pass count
Stress (kPa)
Figure 4. Horizontal stress within the base layer after roller compaction
and test vehicle passes (White, et. al., 2011).
Field determination of the relative density values for the
second or upper subgrade lift after the completion of 21 truck
passes shows 90.2% and 98.5% relative density values were
achieved on the control section and stabilised section,
respectively. These numbers demonstrated that the aggregate
placed over the geogrid can be compacted to a much higher
degree than the unstabilised control section.
Lateral stress ratio (K) is calculated as the ratio of total
horizontal to total vertical stresses for the subgrade and subbase
layers following roller and trafficking passes. Resulting values
are presented in Table 2. The calculated K values demonstrate
that during trafficking, the K values are about 0.3 to 0.7 for the
subgrade and 0.5 to 0.7 for the subbase for all test sections.
However, the K values after 75 trafficking passes show buildup
of horizontal stresses with relatively high K values in the
control section subgrade layer compared to the geogrid
stabilised section. The stabilisation ratio provides a clear
indication of degree of improvement. For this study the geogrid
results in a section that is 8 times better than the control with
regard to stress distribution.
Table 2. Performance comparison between test sections.
Section
K
subgrade
K
base
Stabilisation Ratio
Control section
3.2
1.2
0.4
Stabilised section
1.0
3.2
3.2
3 FIELD STUDY 2 - SALT LAKE CITY, UTAH, USA
3.1 Research background
A field study at a site located in Salt Lake City, Utah, United
Stated of America was conducted to evaluate the effect of a
mechanically stabilised platform to bridge over challenging soft
subgrade areas. All test sections are backfilled with 150-mm
minus pit run (unprocessed) gravel. A total of four sections
were constructed and trafficked and two of the sections were
stabilised by a layer of integrally formed punched and drawn
triangular aperture geogrid placed at the interface between the
subgrade and bridging material.
In-ground piezoelectric earth pressure cells (EPC) were used
to evaluate the support conditions of the test sections.
Measurements of tire ruts were recorded during the survey
between passes of the haul truck.
Goals of this field investigation were to:
-
Validate ability of a geogrid to reduce lateral pressures
within the subgrade under heavy loading conditions and
very soft soils.
-
Assess the ability of geogrid to stabilize pit run gravel and
quantify the benefits for different conditions and loading
scenarios.
-
Provide surface and subgrade data on heavier loading
scenarios.
3.2 Materials.
3.2.1 Subgrade soil and pit-run gravel
Test beds consisted of two materials in this study – low
plasticity clay subgrade and pit-run gravel material. A Dynamic
Cone Penetrometre (DCP) test was performed in accordance
with ASTM D6951-03 using a 4.6-kg single mass hammer.
Results were used to determine the strength of subgrade with
depth. The near surface California Bearing Ratio (CBR) for the
subgrade material varied from about 0.2% to 0.4%.
Aggregate fill material consisted of pit run gravel with a
maximum particle size of 150 mm. An enhanced, second
generation University of Illinois Aggregate Image Analyzer
(UIAIA) was used to determine morphological indices, such as
angularity index, AI (Rao et al., 2002) and surface texture index,
ST (Rao et al., 2003) of the pit run gravel used in the test.
Angularity is critical for aggregate interlock and surface texture
has been found to directly influence friction between aggregate
particles as well as the strength of the aggregate. The AI and ST
indices are determined based on the particle image outlines
obtained from each of the top, side and front of coarse particles.
Morphological index results of the aggregate samples are
presented in Figure 5 and 6.
About 88% of the aggregate samples have angularity index
values that are less than 325 and surface texture index values
less than 1.375. These values indicate that the pit run gravel
used in this study consists of rounded and very smooth surface
aggregate particles.
0
50
100
150
200
250
300
350
400
450
500
550
0
5
10
15
20
25
Angularity
Index
Particler No.
Retained on 4.75 mm sieve
Retained on 9.5 mm sieve
Retained on 19 mm sieve
Figure 5. Angularity Indices of the Pit Run Gravel.
0
0.25
0.5
0.75
1
1.25
1.5
1.75
2
2.25
2.5
0
5
10
15
20
25
Surface
Texture
Particler No.
Retained on 4.75 mm sieve
Retained on 9.5 mm sieve
Retained on 19 mm sieve
Figure 6. Surface Textures of the Pit Run Gravel.
3.2.2 Geosynthetics
Two geosynthetic materials were used during this investigation.
Some physical properties of each geosynthetic material are
summarized in Table 3.


