1375
Technical Committee 202 /
Comité technique 202
prepared with a cement content of 2%, 3%, 4% and 5% and a
degree of compaction from 83% to 86% (LC-low compaction),
and with a cement content of 2% and 3% and a degree of
compaction from 95% to 98% (MC-medium compaction). All
of these specimens have been previously tested with seismic
waves (see 1.3). For each cement content value three constant
confining pressures (30, 50 and 100 kPa) were applied, leading
to 18 tests. The triaxial tests were performed according to CEN
ISO/TS 17892-9 (2004) standard, with saturation, consolidation
and triaxial compression.
To measure the axial strain three linear variable differential
transformers (LVDT) were fixed in the specimen, while for
radial deformation, a system was developed for measuring the
variation of the perimeter using one LVDT which is mounted
between the ends of a wire that surrounds the specimen. The
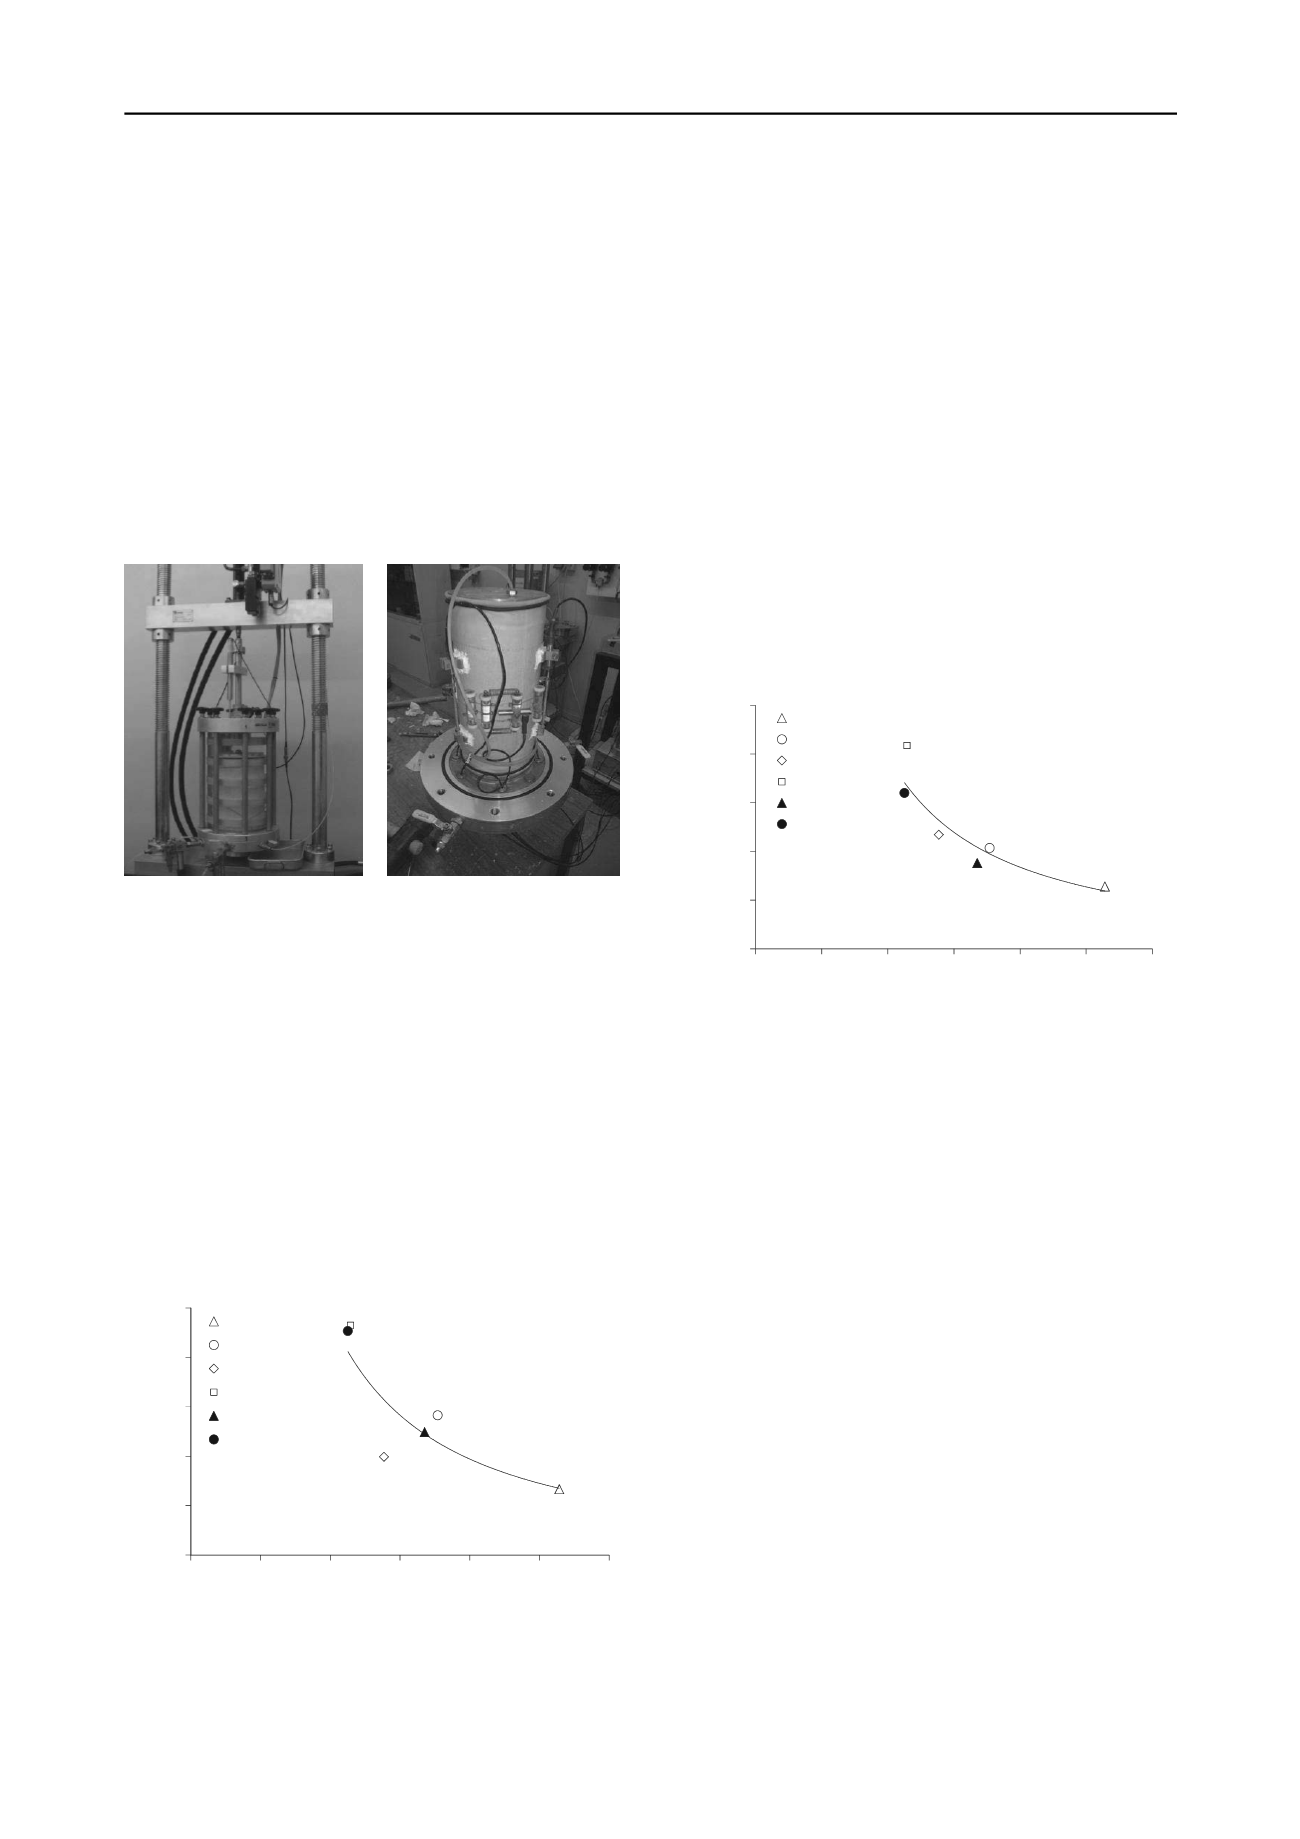
wire is kept under tension by two helical springs (Figure 5).
a)
b)
Figure 5. Triaxial test equipment: a) cell and load frame apparatus; b)
axial and radial deformation transducers installed on the specimen.
During shear compression, at 0.0016 mm/second, the
specimens were submitted to two unload/reload cycles in order
to define the quasi-elastic behaviour. Some of the stress-strain
curves obtained in the tests are presented in Section 3 of this
paper, when discussing the numerical modelling of the tests.
Figure 6 shows the relationship between the adjusted
porosity/cement ratio and deformability modulus computed at
50% of ultimate shear strength for specimens with confining
pressure of 100 kPa (E
50
ref
). The mixtures are referenced by the
percentage of cement and the type of compaction (for example,
2_LC means a mixture with 2% of cement content and low
compaction). In this analyses, the best correlation is also found
to an exponent of 1.0, but it is associated with a lower
coefficient of determination (R
2
=0.76) than those presented
above.
R² = 0.76
0
1
2
3
4
5
0
5
10
15
20
25
30
E
50
ref
[GPa]
n / C
iv
1.0
2_LC
3_LC
4_LC
5_LC
2_MC
3_MC
E
50
ref
= 97.71 (n / C
iv
1.0
)
-1.308
Figure 6. Relationship between E
50
ref
and
n
/C
iv
x
.
It is important to point out that, with exception of 4_LC
specimen, there was a significant increase in the deformability
modulus with increasing cement content. Furthermore, it is also
interesting to note the significant increase in deformability
modulus with degree of compaction, when comparing mixtures
having the same cement content.
Strength parameters, such as the angle of shearing resistance
(
’
) and the cohesion intercept (c’), were computed using the
results of three specimens of each type of mixture, with similar
compaction and the same cement content, for different isotropic
consolidation pressures.
With regard to the angle of shearing resistance, there is a
slight increase from 40° to 42° when the cement content
increases from 2% to 5% in the samples with low compaction.
In the samples with medium compaction it was computed a
angle of shearing resistance of 58°, regardless of the cement
content, which shows the great importance of the compaction on
the mechanical characteristics of the mixtures.
The values of c' ranged from 250 kPa to 830 kPa, reflecting a
significant increase in this parameter with the increase of the
cement content. For specimens with low compaction, the
increase from 2% to 5% in the cement content causes an
increase of c' from 255 kPa to 835 kPa. Figure 7 shows the
relationship between the cohesion intercept and the
porosity/cement ratio. The best correlation is also achieved for
an exponent of 1.0, with a coefficient of determination R
2
=0.88.
R² = 0.88
0
200
400
600
800
1000
0
5
10
15
20
25
30
c' [kPa]
n/ C
iv
1.0
2_LC
3_LC
4_LC
5_LC
2_MC
3_MC
c' = 13607 (n / C
iv
1.0
)
-1.236
Figure 7. Relationship between cohesion intercept and
n
/C
iv
x
.
Considering the presented results, it could be concluded that
it is possible to assume the value 1.0 for the exponent x, when
one intend to relate the adjusted porosity/cement ratio with
mechanical properties of these aggregates, with exception of the
tensile strength.
3 MODELLING OF TRIAXIAL TESTS
Based on the triaxial test results, a calibration of the
geo-mechanical parameters for the Hardening Soil Model
available on the commercial software Plaxis
was made. The
model parameters that were considered for each
aggregate-cement mixture are shown in Table 1.
This paper presents only the tests results and the modelling
curves (mod) for the specimens with 2% of cement content,
with low compaction (Figure 8) and with medium compaction
(Figure 9). As previously mentioned, three different values of
confining pressure were applied (30, 50 and 100 kPa). Further
details can be seen in Viana da Fonseca et al. (2012).
The analysis of Figures 8 and 9 shows that: a) the curves that
relate the deviatoric stress with the axial deformation are fairly
well approximated by the modelling curves, in particular for
mixtures with low compaction; b) it is rather difficult to model
the curves that relate the volumetric deformation with the axial
deformation, particularly for the higher values of the confining
pressure. For the tests performed on other aggregate-cement
mixtures similar trends were found.


