 
          1400
        
        
          Proceedings of the 18
        
        
          th
        
        
          International Conference on Soil Mechanics and Geotechnical Engineering, Paris 2013
        
        
          10
        
        
          -4
        
        
          10
        
        
          -3
        
        
          10
        
        
          -2
        
        
          10
        
        
          -1
        
        
          1
        
        
          0.0
        
        
          0.2
        
        
          0.4
        
        
          0.6
        
        
          0.8
        
        
          1.0


            ACL (this study)


          Location #1 (


          0
        
        
          ~ 11 - 89 kPa)
        
        
          Location #2 (


          0
        
        
          ~ 11 - 106 kPa)


            Zekkos et al. 2008 (


            0


            < 125 kPa)


          100% material < 20 mm
        
        
          62-76% material < 20 mm
        
        
          8-25% material < 20 mm


            G


          /


            G


            max


          Shearing Strain (%)
        
        
          Figure 2. Modulus reduction curves of MSW (


            Zekkos et al.


          ).
        
        
          The paper by


            Liao et al.


          (USA) provides very useful
        
        
          laboratory test data on the ‘Normalized shear modulus of
        
        
          compacted gravel’ used for fills. Resonant Column and
        
        
          Torsional Shear (RCTS) tests were performed on large diameter
        
        
          specimens of poorly graded (PA) gravel and well-graded (WA)
        
        
          sandy gravel, both scalped at 19 mm particle size. The curves
        
        
          for the WA and PA samples (Fig. 3) fall in the ranges suggested
        
        
          by Seed et al. (1986) and Rollins et al. (1998) respectively, and
        
        
          are quite consistent with the stress-dependent curves suggested
        
        
          by Menq (2003) on the basis of the modified hyperbolic model
        
        
          formulated by Darendeli (2001). Once again, it is expected that
        
        
          similar considerations about the dependency on grading and
        
        
          stress state would hold for the damping-strain curves.


            0.0


            0.1


            0.2


            0.3


            0.4


            0.5


            0.6


            0.7


            0.8


            0.9


            1.0


            0.0001


            0.001


            0.01


            0.1


            1


            Cyclic Shear Strain,


            (%)


            G/G


            max


            52, 207, 414, 827 kPa; C


            u


            = 150 (Menq, 2003)


            WA (414 kPa)


            PA (52 kPa)


            WA (52 kPa)


            WA (207 kPa)


            WA (827 kPa)


            PA (207 kPa)


            52, 207 kPa; C


            u


            = 2.1


            (Menq, 2003)


          Figure 3. Modulus reduction curves of compacted gravels (


            Liao et al.


          )


            .


            Ray & Szilvágyi


          (Hungary), authors of the paper ‘Measuring
        
        
          and modeling the dynamic behavior of Danube Sands’, report
        
        
          and discuss results obtained by a RCTS device on hollow
        
        
          pluviated specimens of a typical alluvial sand. The equipment,
        
        
          originally developed by the first author in USA (Ray & Woods,
        
        
          1987), was updated in Győr University in order to be capable of
        
        
          loading at higher torques and measuring wider strain ranges,
        
        
          under non-isotropic confining stresses and irregular cyclic shear
        
        
          loads. The Authors mention, although not showing the
        
        
          comparisons, that such data were satisfactorily interpreted by
        
        
          the Ramberg-Osgood model with extended Masing criteria.


            Sas et al


          (Poland) investigate ‘The behaviour of natural
        
        
          cohesive soils under dynamic excitations’, by RC tests on
        
        
          natural shallow samples of silty sand, subjected to stepwise
        
        
          consolidation stages. The normalized shear modulus-strain
        
        
          curves, however, appear excessively non-linear for some of the
        
        
          confining stress levels: this may be due to several experimental
        
        
          factors, including strain measurement resolution and/or effects
        
        
          of the consolidation procedure followed.
        
        
          3 MEASUREMENT AND MODELLING OF CYCLIC
        
        
          DEGRADATION, STRENGTH AND LIQUEFACTION
        
        
          3.1


            Clean sands


            Bolouri Bazaz & Bolouri Bazaz


          (Iran) present ‘An experimental
        
        
          approach to evaluate shear modulus and damping ratio of
        
        
          granular material’, a Standard Leighton Buzzard sand. Loose
        
        
          and dense dry specimens were prepared by air-pluviation in a
        
        
          cubic Biaxial Testing (BT) device, able to apply independent
        
        
          variations of horizontal principal stresses by hydraulic actuators.
        
        
          Repeated sequences of cyclic loads with increasing peak stress
        
        
          ratios, R
        
        
          max
        
        
          , showed that both dense and loose sand underwent
        
        
          progressive densification with the number of cycles. The stress-
        
        
          strain behaviour was featured by a kind of ‘elastic shakedown’,
        
        
          i.e. closed loops corresponding to steady shear modulus and
        
        
          damping ratio approaching zero (Fig. 4). At the highest stress
        
        
          ratio, soil behaviour turned to softening and dilatant, eventually
        
        
          leading to a ‘run away’ failure. The results encourage to an
        
        
          interpretation in terms of hardening plasticity models.
        
        
          0 10 20 30 40 50 60 70 80 90 100
        
        
          No. of cycles
        
        
          0
        
        
          10
        
        
          20
        
        
          30
        
        
          40
        
        
          50
        
        
          60
        
        
          70
        
        
          80
        
        
          Shear modulus (GPa)
        
        
          Test No.: D-290
        
        
          R      =4
        
        
          R      =4.33
        
        
          max
        
        
          max
        
        
          0 10 20 30 40 50 60 70 80 90 100
        
        
          No. of cycles
        
        
          0
        
        
          10
        
        
          20
        
        
          30
        
        
          40
        
        
          50
        
        
          Damping ratio (%)
        
        
          Test No.: D-290
        
        
          R      = 4
        
        
          max
        
        
          Figure 4. Cyclic evolution of modulus and damping for dry dense sand
        
        
          (


            Bazaz et al.


          ).
        
        
          A further interesting contribution from Iran is by


            Jafarzadeh


            & Zamanian


          , investigating the ‘Effect of stress anisotropy on
        
        
          cyclic behavior of dense sand with dynamic Hollow Cylinder
        
        
          apparatus’ (HC). Wet tamped specimens of uniform Babolsar
        
        
          sand were saturated and isotropically consolidated at the same
        
        
          effective stress, then subjected to constant amplitude shear loads
        
        
          corresponding to different ratios between torsional shear and
        
        
          deviator stress, i.e. to different degrees of stress-induced
        
        
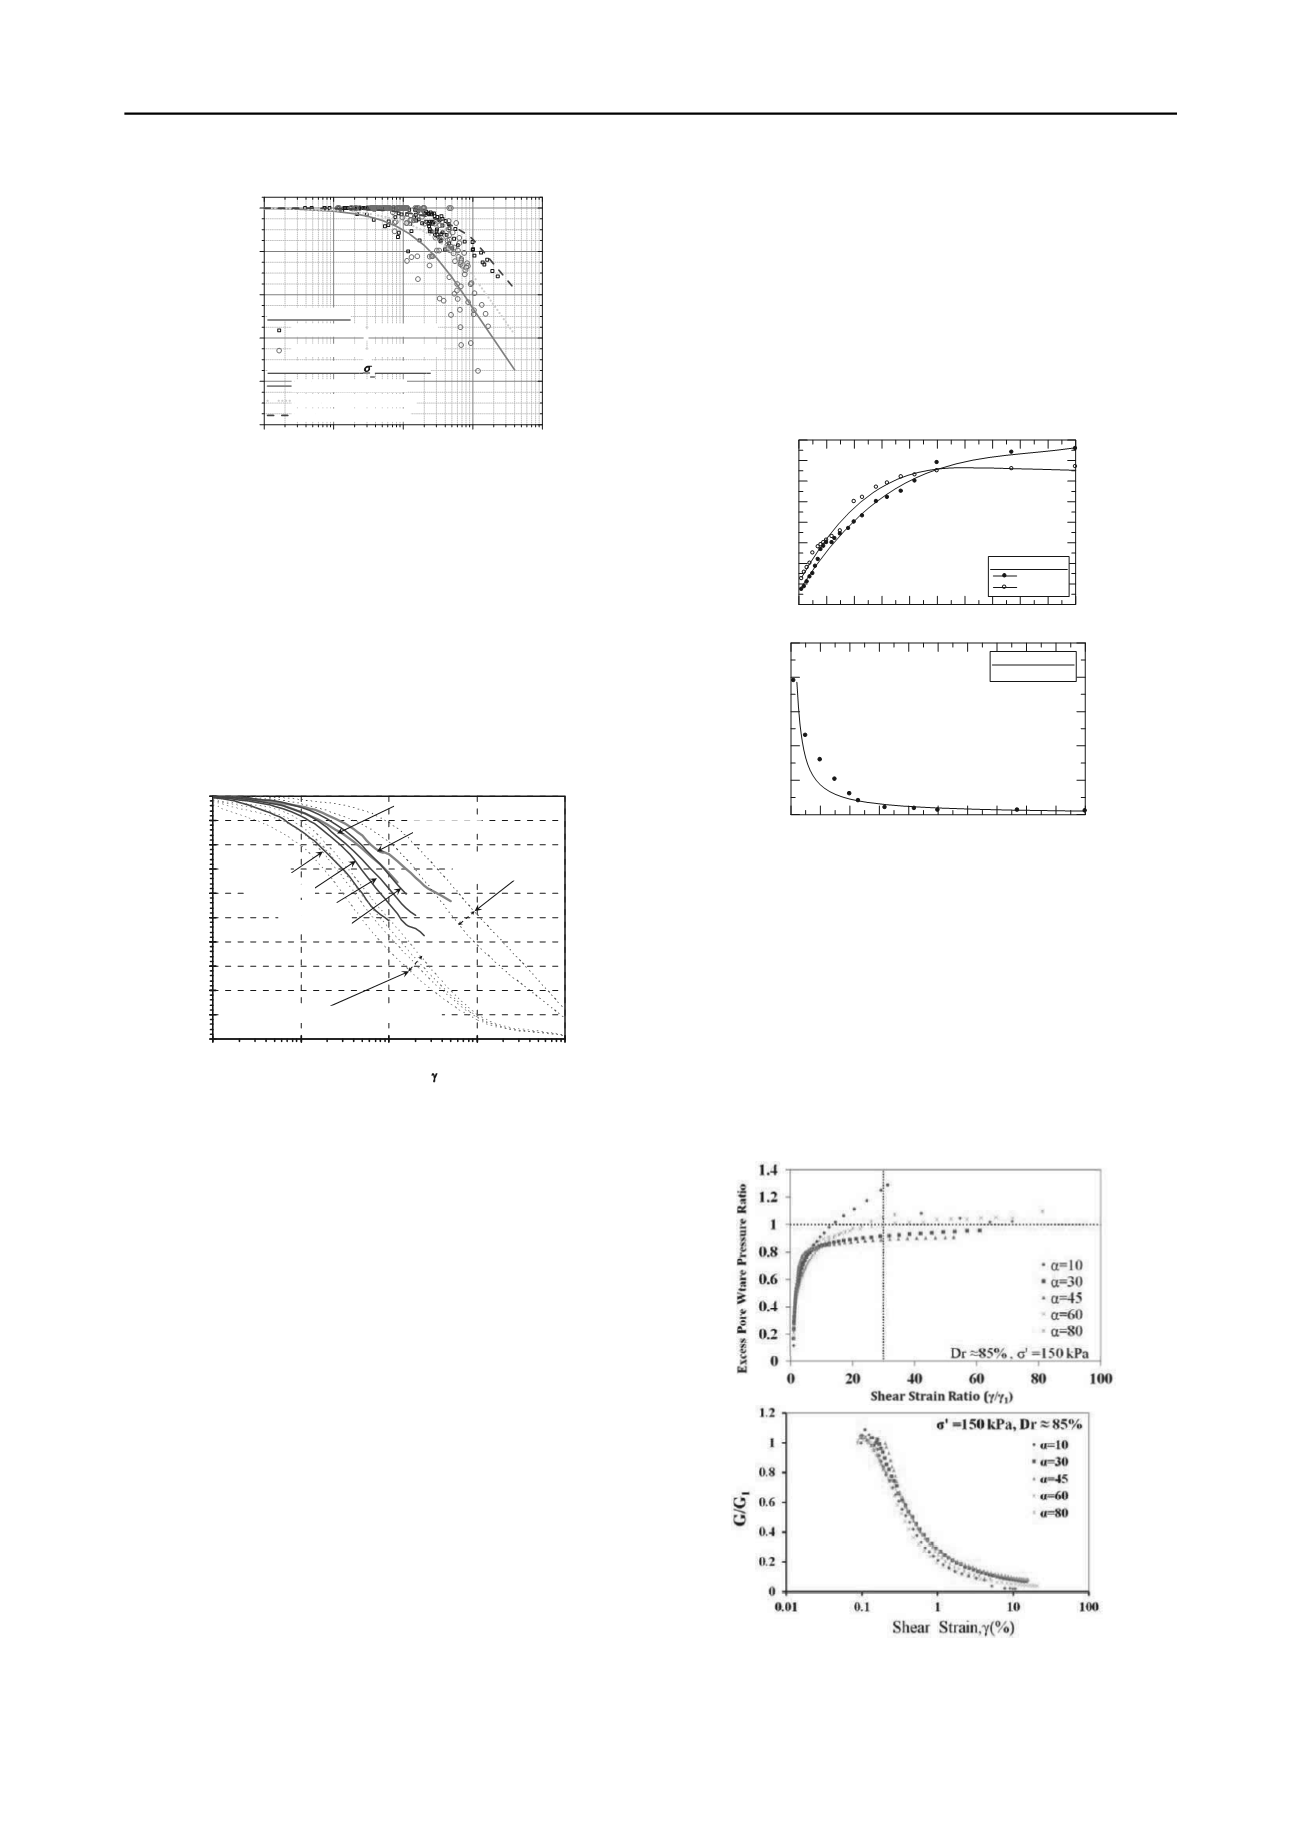
          anisotropy. Results show that the angle


          , representing stress
        
        
          anisotropy, does affect the excess pore water pressure ratio (Fig.
        
        
          5a), but has no significant influence on the strain dependency of
        
        
          shear modulus (Fig. 5b) and damping ratio.
        
        
          (a)
        
        
          (b)
        
        
          Figure 5. Effects of stress anisotropy on pore water pressure (a) and
        
        
          shear modulus (b) for saturated dense sand (


            Jafarzadeh & Zamanian


          ).
        
        
          Another study on the effects of loading pattern on cyclic
        
        
          behaviour of clean sands is provided by


            Coelho et al.


          (Portugal-