1410
Proceedings of the 18
th
International Conference on Soil Mechanics and Geotechnical Engineering, Paris 2013
Lucy, L 1977. A numerical approach to testing the fission hypothesis.
Astronomical Journal
, Vol. 81, pp.1013–1024.
6 REFERENCES
Asaoka, A., Nakano, M. and Noda, T. 2000. Superloading yield surface
concept for highly structured soil behavior,
Soils and Foundations
,
Vol.40, No.2, pp.99-110.
Cundall, P. and Board, M. 1988. A microcomputer program for
modeling large-strain plasticity problems,
Numerical Methods in
Geomechanics (Innsbruck 1988)
, pp.2101-2108.
Gingold R.A. and Monaghan J.J. 1977. Smoothed particle
hydrodynamics: theory and applications to non-spherical stars.
Monthly Notices of the Royal Astronomical Society
, Vol. 181, pp.
375–389.
Murono, Y. and Nogami, Y. 2006. Stress-strain relation of soil
considering S-shape history curve,
Proceedings of the 12th
Japan
Earthquake Engineering Symposium
, pp. 494-497 (In Japanese).
Shinoda, M., Nakajima, S., Nakamura, H., Kawai, T. and Nakamura, S.
2013. Shaking table test of large slope model with vertical and
horizontal acceleration using E-Defense,
Proceedings of the 18th
International Conference on Soil Mechanics and Geotechnical
Engineering, Paris
.
Sulsky, D., Chen, .Z and Schreyer, H. L. 1994. A particle method for
history-dependent materials.
Computer methods in applied
mechanics and engineering
, Vol. 118, pp. 176-196.
Sulsky, D., Zhou, S.J. and Schreyer, H.L. 1995. Application of a
particle-in-cell method to solid mechanics,
Computer Physics
Communications
, 87, pp236-252.
Towhata, I. and Ishihara, K. 1985. Modeling soil behavior under
principal stress axes rotation,
Proc. of 5th International Conf. on
Num. Methods in Geomechanics
, Vol.1, pp. 523-530.
-1000
-500
0
500
1000
0
10
20
30
40
50
6
�
�
�
x(Gal)
時間 (sec)
0
入力
応答(実験)
応答(解析)
-1000
-500
0
500
1000
17.0
17.5
18.0
18.5
19.0
19.5
20.0
20.5
21.0
21.5
22.0
�
�
�
x(Gal)
時間 (sec)
Minimumanalysisvalue
(
19.08sec
)
Minimum testvalue
(
19.03sec
)
Time (sec)
Time (sec)
A
cceleration
(gal)
A
cceleration
(gal)
Input
Test
FEM
(a) Lateral response acceleration
-12
-8
-4
0
4
0
10
20
30
40
50
6
�
�
�
�
ハ(m
m
)
時間 (sec)
0
実験
解析
-25
0
25
50
0
10
20
30
40
50
�
�
�
�
ハ(m
m
)
時間 (sec)
60
実験
解析
Lateraldisplacem
ent (m
m
)
Verticaldisplacem
ent (m
m
)
Time (sec)
Time ( ec)
Test
FEM
Test
FEM
(b) Lateral and vertical response displacement
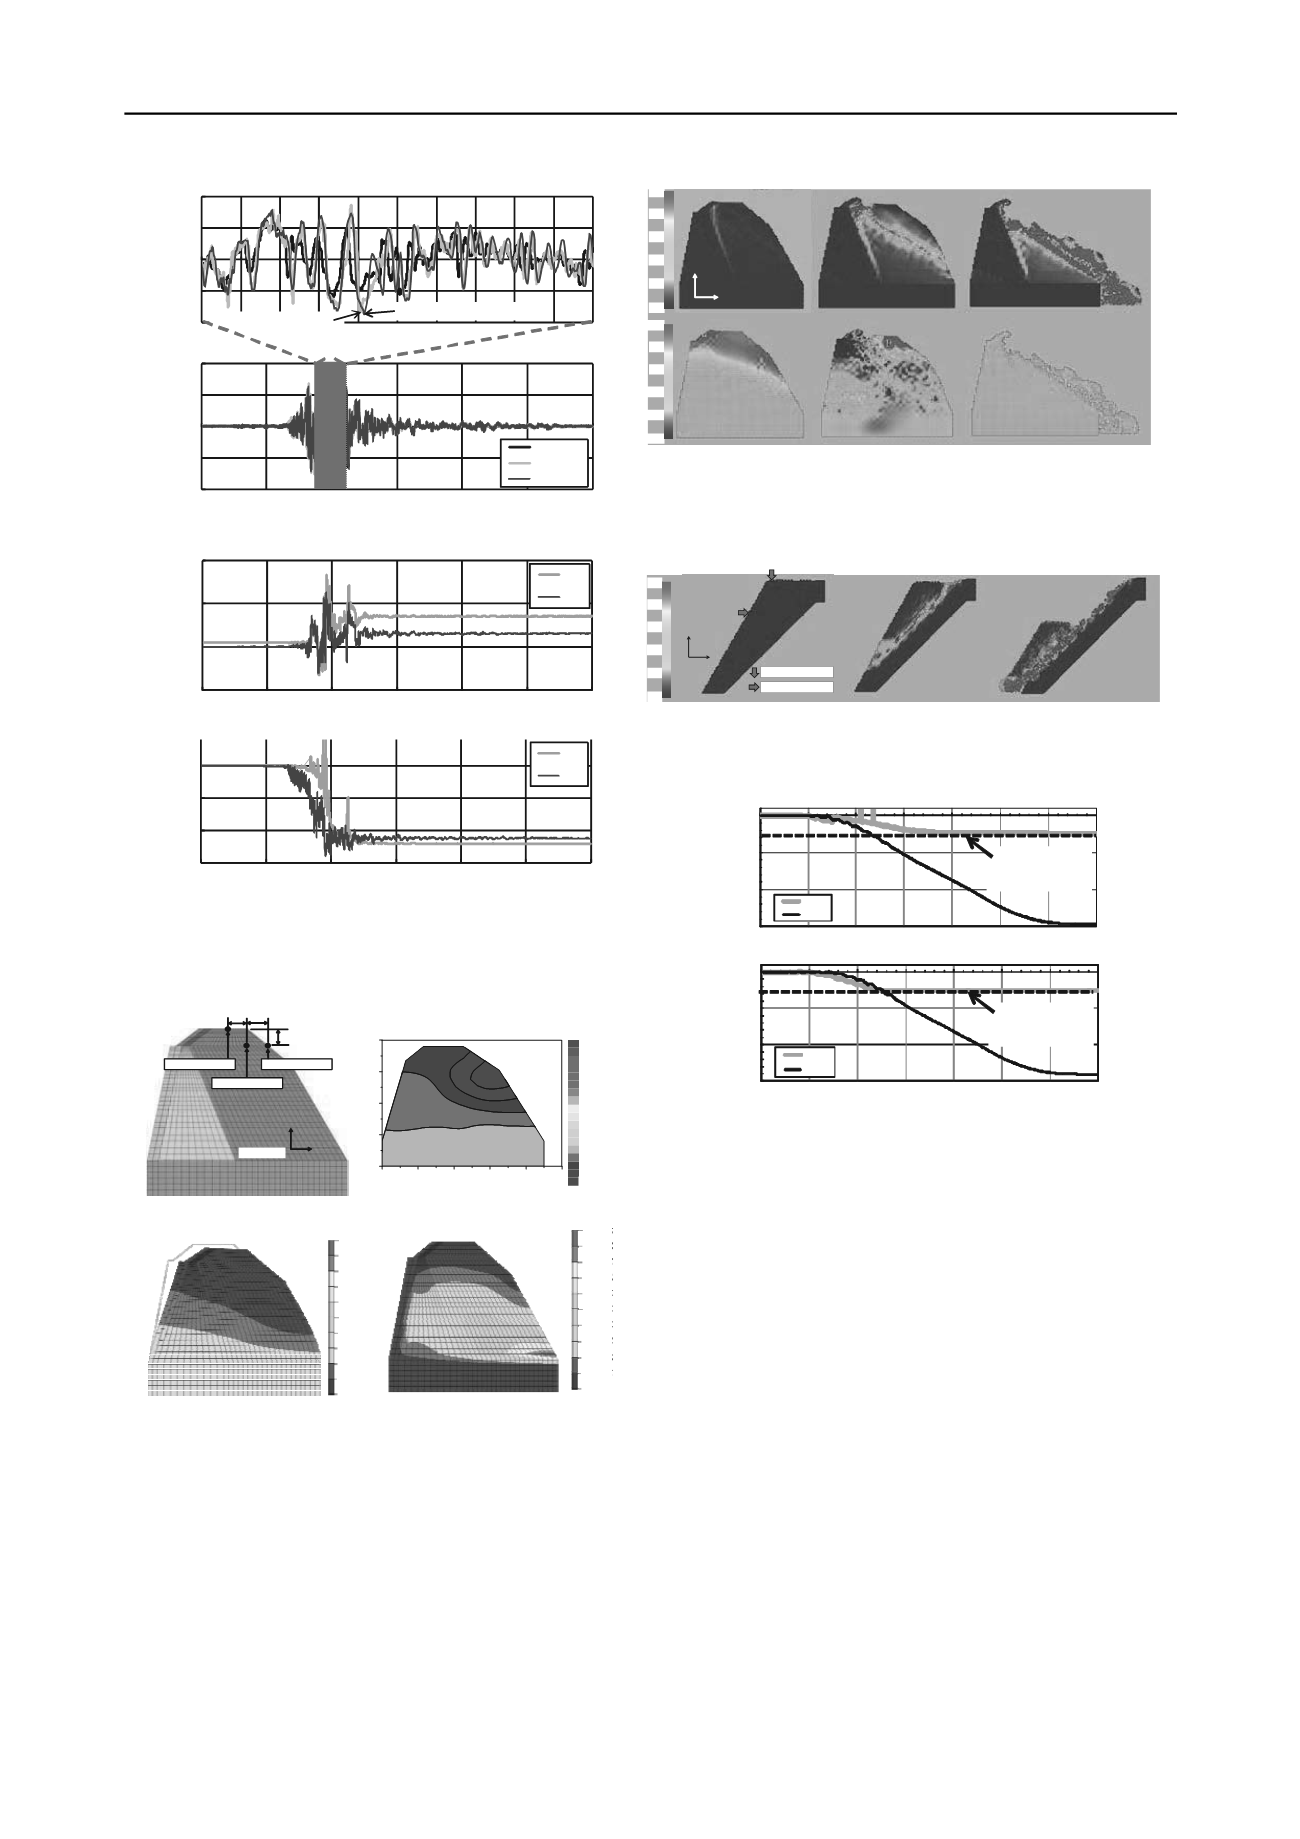
Figure 7. Analytical results and test results of lateral response
acceleration and response displacement at the observation points
Unit:mm
y
x
Lateraldisplacement
550 650
450
LateralAcceleration
Verticaldisplacement
-
-
-
2
6
9
200
600
900
‐200
‐600
‐900
0
1
2
3
4
5
0
1
2
3
4
x
(m)
y
(m)
(a) Observation points (b) Lateral acceleration (test)
‐900
‐720
‐540
‐360
‐180
0.0
180
360
540
720
900
0.0
0.005
0.011
0.017
0.022
0.028
0.033
0.039
0.044
0.050
0.055
(c) Lateral acceleration (FEM) (d) Maximum shear strain (FEM)
Figure 8. Positions of observation points, distributions of lateral
acceleration (unit: gal) and maximum shear strain when the
amplitude of lateral response acceleration is the minimum
1.0
0.8
0.6
0.4
0.2
0.0
y
x
1000
600
200
‐200
‐600
‐1000
(a) 16.3 sec (b) 19.0 sec (c) 40.0 sec
Figure 9. Processes of distributions of maximum shear strain (upper
figure) and lateral response acceleration (below figure, unit: gal) of one
layered model
1.0
0.8
0.6
0.4
0.2
0.0
Verticaldisplacement
y
x
Lateraldisplacement
(a) 1.2 sec (b) 2.0 sec (c) 7.0 sec
Figure 10. Processes of distributions of maximum shear strain of three
layered model
-1,500
-1,000
-500
0
0.0
1.0
2.0
3.0
4.0
5.0
6.0
7.0
Laterald
isplacem
nt(m
m
)
Time (sec)
Test
MPM
Max. range
of transducer
-1,500
-1,000
-500
0
0.0
1.0
2.0
3.0
4.0
5.0
6.0
7.
Verticaldisplacement(m
m
)
Time (sec)
0
Test
MPM
Max. range
of transducer
Figure 11. Time histories of lateral response displacement (upper figure)
and vertical response displacement (below figure) of the three layered
model at the observation points
Lucy, L 1977. A numerical approach to testing the fission hypothesis.
Astronomical Journal
, Vol. 81, pp.1013–1024.
6 REFERENCES
Asaoka, A., Nakano, M. and Noda, T. 2000. Superloading yield surface
concept for highly structured soil behavior,
Soils and Foundations
,
Vol.40, No.2, pp.99-110.
Cundall, P. and Board, M. 1988. A microcomputer program for
modeling large-strain plasticity problems,
Numerical Methods in
Geomechanics (Innsbruck 1988)
, pp.2101-2108.
Gingold R.A. and Monaghan J.J. 1977. Smoothed particle
hydrodynamics: theory and applications to non-spherical stars.
Monthly Notices of the Royal Astronomical Society
, Vol. 181, pp.
375–389.
Murono, Y. and Nogami, Y. 2006. Stress-strain relation of soil
considering S-shape history curve,
Proceedings of the 12th
Japan
Earthquake Engineering Symposium
, pp. 494-497 (In Japanese).
Shinoda, M., Nakajima, S., Nakamura, H., Kawai, T. and Nakamura, S.
2013. Shaking table test of large slope model with vertical and
horizontal acceleration using E-Defense,
Proceedings of the 18th
International Conference on Soil Mechanics and Geotechnical
Engineering, Paris
.
Sulsky, D., Chen, .Z and Schreyer, H. L. 1994. A particle method for
history-dependent materials.
Computer methods in applied
mechanics and engineering
, Vol. 118, pp. 176-196.
Sulsky, D., Zhou, S.J. and Schreyer, H.L. 1995. Application of a
particle-in-cell method to solid mechanics,
Computer Physics
Communications
, 87, pp236-252.
Towhata, I. and Ishihara, K. 1985. Modeling soil behavior under
principal stress axes rotation,
Proc. of 5th International Conf. on
Num. Methods in Geomechanics
, Vol.1, pp. 523-530.
-1 00
-500
0
500
1000
0
10
20
30
40
50
6
�
�
�
x(Gal)
時間 (sec)
0
入力
応答(実験)
応答(解析)
-1000
-500
0
500
1000
17.0
17.5
18.0
18.5
19.0
19.5
20.0
20.5
21.0
21.5
22.0
�
�
�
x(Gal)
時間 (sec)
Minimumanalysisvalue
(
19.08sec
)
Minimum testvalue
(
19.03sec
)
Time (sec)
Time (sec)
A
cceleration
(gal)
A
cceleration
(gal)
Input
Test
FEM
(a) Lateral response acceleration
-12
-8
-4
0
4
0
10
20
30
40
50
6
�
�
�
�
ハ(m
m
)
時間 (sec)
0
実験
解析
-25
0
25
50
0
10
20
30
40
50
�
�
�
�
ハ(m
m
)
時間 (sec)
60
実験
解析
Lateraldisplacem
ent (m
m
)
Verticaldisplacem
ent (m
m
)
Tim (sec)
Time ( ec)
Test
FEM
Test
FEM
(b) Lateral and vertical response displacement
Figure 7. Analytical results and test results of lateral response
acceleration and response displacement at the observation points
Unit:mm
y
x
Lateraldisplacement
550 650
450
LateralAcceleration
Verticaldisplacement
-
-
-
2
6
9
200
600
900
‐200
‐600
‐900
0
1
2
3
4
5
0
1
2
3
4
x
(m)
y
(m)
(a) Observation points (b) Lateral acceleration (test)
‐900
‐720
‐540
‐360
‐180
0.0
180
360
540
720
900
0.0
0.005
0.011
0.017
0.022
0.028
0.033
0.039
0.044
0.050
0.055
(c) Lateral acceleration (FEM) (d) Maximum shear strain (FEM)
Figure 8. Positions of observation points, distributions of lateral
acceleration (unit: gal) and maximum shear strain when the
amplitude of lateral response acceleration is the minimum
1.0
0.8
0.6
0.4
0.2
0.0
y
x
1000
600
200
‐200
‐600
‐1000
(a) 16.3 sec (b) 19.0 sec (c) 40.0 sec
Figure 9. Processes of distributions of maximum shear strain (upper
figure) and lateral response acceleration (below figure, unit: gal) of one
layered model
1.0
0.8
0.6
0.4
0.2
0.0
Verticaldisplacement
y
x
Lateraldisplacement
(a) 1.2 sec (b) 2.0 sec (c) 7.0 sec
Figure 10. Processes of distributions of maximum shear strain of three
layered model
-1,500
-1,000
-500
0
0.0
1.0
2.0
3.0
4.0
5.0
6.0
7.0
Laterald
isplacem
nt(m
m
)
Time (sec)
Test
MPM
Max. range
of transducer
-1,500
-1,000
-500
0
0.0
1.0
2.0
3.0
4.0
5.0
6.0
7.
Verticaldisplacement(m
m
)
Time (sec)
0
Test
MPM
Max. range
of transducer
Figure 11. Time histories of lateral response displacement (upper figure)
and vertical response displacement (below figure) of the three layered
model at the observation points
Lucy, L 1977. A numerical approach to testing the fission hypothesis.
-1000
-500
0
500
1000
0
10
20
30
40
50
6
�
�
�
x(Gal)
時間 (sec)
0
入力
応答(実験)
応答(解析)
-1000
-500
0
500
1000
17.0
17.5
18.0
18.5
19.0
19.5
20.0
20.5
21.0
21.5
22.0
�
�
�
x(Gal)
時間 (sec)
Minimumanalysisvalue
(
19.08sec
)
Minimum testvalue
(
19.03sec
)
Time (sec)
Time (sec)
A
cceleration
(gal)
A
cceleration
(gal)
Input
Test
FEM
(a) Lateral response acceleration
4
-25
0
25
50
0
10
20
30
40
50
�
�
�
�
ハ(m
m
)
時間 (sec)
60
実験
解析
Lateraldisplacem
ent (m
m
)
)
Time ( ec)
Test
FEM
1.0
0.8
0.6
0.4
0.2
0.0
y
x
1000
600
200
‐200
‐600
‐1000
(a) 16.3 sec (b) 19.0 sec (c) 40.0 sec
Figure 9. Processes of distributions of maximum shear strain (upper
figure) and lateral response acceleration (below figure unit: gal) of one
layered model
1.0
0.8
0.6
0.4
0.2
0.0
Verticaldisplacement
y
x
Lateraldisplacement
(a) 1.2 sec (b) 2.0 sec (c) 7.0 sec


