 
          1420
        
        
          Proceedings of the 18
        
        
          th
        
        
          International Conference on Soil Mechanics and Geotechnical Engineering, Paris 2013
        
        
          ground improvement and by the difference in the dates of
        
        
          reclamation work. Such causes of extensive damage are, no
        
        
          doubt, correct. However, sufficient explanations have not been
        
        
          provided yet concerning the mechanism of liquefaction
        
        
          occurrence in ground with large fine fraction content and the
        
        
          reason why the liquefaction damage was nonuniform.
        
        
          Figure 2 shows the geological profile of Urayasu City along
        
        
          survey line A-B-C. Starting from the ground surface, the
        
        
          stratum organization broadly consists of reclaimed soil, alluvial
        
        
          sand, alluvial clay, and diluvial deposits, in that order. The
        
        
          reclaimed soil layer is nonhomogeneous, consisting of a
        
        
          complex mixture of sandy and clayey soils. The alluvial sand
        
        
          layer contains silty sand mainly made up of fine particles, the
        
        
          N-value being about 10 to 20. The alluvial clay layer is very
        
        
          weak with an N-value of approximately 0 to 1. Looking at the
        
        
          boundaries of the strata, it can be seen that the boundary
        
        
          between the alluvial sand and alluvial clay layers is almost
        
        
          horizontal, whereas that between the alluvial clay layer and the
        
        
          diluvial layer slopes downwards from Location A (land side,
        
        
          older reclaimed land) towards Location C (sea side, newly
        
        
          reclaimed land). Thus, the alluvial clay deposit is thicker
        
        
          towards Location C. The alluvial clay is about 10 m thick at
        
        
          Location A but extremely thick (more than 40 m) at Location C.
        
        
          Considering the liquefaction damage distribution shown in Fig.
        
        
          1, it can be said that liquefaction damage was light at the land
        
        
          side locations, where the weak clay layer is relatively thin
        
        
          (about 10 m). Progressively heavier damage occurred towards
        
        
          the side of the sea along with the increase in thickness of the
        
        
          weak clay layer with an N-value of nearly zero.
        
        
          This paper examines the cause of the extensive and nonuniform
        
        
          liquefaction damage that occurred in Urayasu City by focusing
        
        
          attention on the weak clay layer and its inclination in the deep
        
        
          part of the liquefied ground and carrying out elasto-plastic
        
        
          seismic response analysis of the multi-layer ground. The
        
        
          analysis code used was the soil-water coupled finite
        
        
          deformation analysis code GEOASIA (Noda et al. 2008), which
        
        
          incorporates an elasto-plastic constitutive model (SYS Cam-
        
        
          clay model; Asaoka et al. 2002) that allows description of the
        
        
          behavior of soils ranging from sand to intermediate soils and
        
        
          clay under the same theoretical framework.
        
        
          2 DEPENDENCY OF SEISMIC BEHAVIOR OF GROUND
        
        
          ON THE ORGANIZATION OF DEEP STRATA
        
        
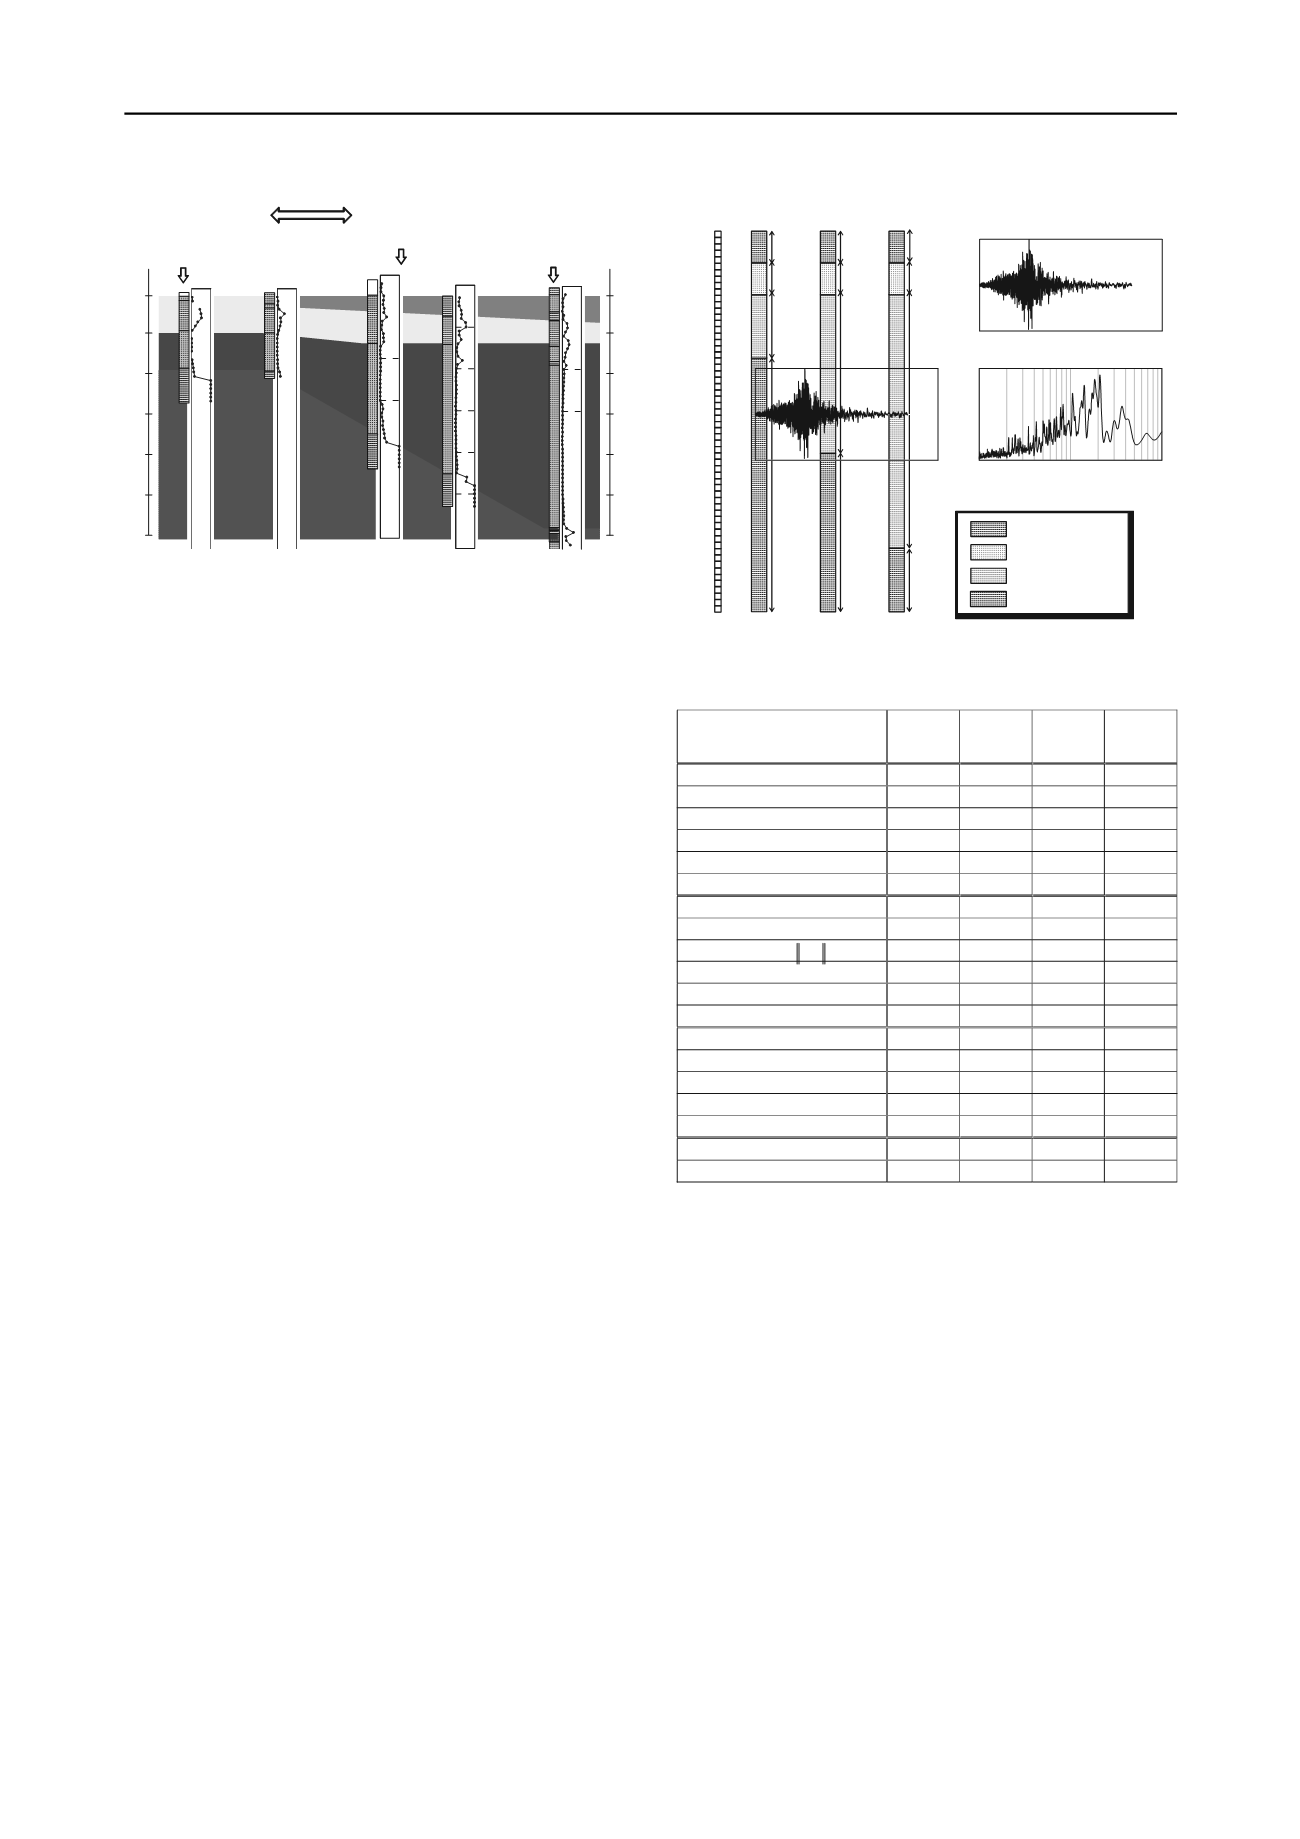
          The effect of the weak clay layer in the deeper part of the
        
        
          ground on the reclaimed soil (silty sand containing fine fraction)
        
        
          was investigated using a one-dimensional model of locations A,
        
        
          B, and C in Fig. 2. Location B is midway between locations A
        
        
          and C. The finite element mesh used in the analysis and the
        
        
          stratum organization at these three locations are shown in Fig. 3.
        
        
          The water pressure at the hydraulic boundary was made to be
        
        
          zero so as to make the ground coincide with the water level, and
        
        
          allowing for the existence of an impermeable layer with low
        
        
          hydraulic conductivity, the bottom face was assumed to be an
        
        
          undrained boundary. The two side faces, too, were assumed to
        
        
          be undrained boundaries. In addition, for defining the cyclic
        
        
          boundary (Noda et al. 2010) on the assumption that the same
        
        
          ground extends infinitely to the left and right sides, equal
        
        
          displacements were assigned as the constraint condition to each
        
        
          nodal element at the same height on both side faces. Table 1
        
        
          shows the material constants and the initial values used in the
        
        
          analysis. Detailed soil surveys are still ongoing in Urayasu City.
        
        
          Therefore, the material constants used in this study were those
        
        
          of soils studied in the past at Nagoya University, which had
        
        
          physical properties relatively similar to the soils at the site. The
        
        
          reclaimed layer, which is assumed to be intermediate soil that is
        
        
          a mixture of sand and clay, is a material that is less prone to
        
        
          liquefaction than sandy soil. With respect to the initial values, it
        
        
          was assumed that the specific volume, degree of structure, stress
        
        
          ratio, and degree of anisotropy were uniform in the direction of
        
        
          depth. The overconsolidation ratio was distributed based on the
        
        
          overburden pressure. In locations A, B, and C, the conditions of
        
        
          5m
        
        
          5m
        
        
          40m
        
        
          10m
        
        
          5m
        
        
          5m
        
        
          25m
        
        
          25m
        
        
          5m
        
        
          5m
        
        
          10m
        
        
          40m
        
        
          Reclaimed soil
        
        
          Alluvial sand
        
        
          Alluvial clay
        
        
          Diluvial soil
        
        
          A B C
        
        
          1m
        
        
          ×
        
        
          1m
        
        
          ×
        
        
          60
        
        
          0
        
        
          100
        
        
          200
        
        
          300
        
        
          -50
        
        
          0
        
        
          50
        
        
          Time (sec)
        
        
          Acceleration (gal)
        
        
          10
        
        
          -1
        
        
          10
        
        
          0
        
        
          10
        
        
          1
        
        
          0
        
        
          50
        
        
          0
        
        
          100
        
        
          200
        
        
          300
        
        
          -50
        
        
          0
        
        
          50
        
        
          Period (sec)
        
        
          Time (sec)
        
        
          FourierAmplitude (gal*s)
        
        
          Acceleration (gal)
        
        
          Input seismic wave
        
        
          Figure 3. Finite element mesh and stratum organization at points A to C
        
        
          and input seismic wave
        
        
          Table 1 Material constants and initial values used in the analysis
        
        
          Dilluvial
        
        
          deposit
        
        
          Alluvial
        
        
          Clay
        
        
          Alluvial
        
        
          Sand
        
        
          Reclaimed
        
        
          Sand


              Elasto-plastic parameters


          Critical state index M
        
        
          1.00
        
        
          1.60
        
        
          1.00
        
        
          1.70
        
        
          NCL intercept N
        
        
          2.10
        
        
          2.50
        
        
          2.00
        
        
          2.50
        
        
          Compression index


          ~
        
        
          0.20
        
        
          0.40
        
        
          0.20
        
        
          0.15
        
        
          標高
        
        
          TP(m)
        
        
          0.00
        
        
          0.00
        
        
          0.00
        
        
          0.00
        
        
          0.00
        
        
          0.00
        
        
          0.00
        
        
          -10.
        
        
          -20.
        
        
          -30.
        
        
          -40.
        
        
          -50.
        
        
          -60.
        
        
          0.
        
        
          B
        
        
          地点
        
        
          A
        
        
          地点
        
        
          沖積粘土
        
        
          0 25   50
        
        
          沖積砂
        
        
          埋土
        
        
          0 25   50
        
        
          0 25   50
        
        
          0 25   50
        
        
          0 25   50
        
        
          標高
        
        
          TP(m)
        
        
          A
        
        
          B
        
        
          C
        
        
          No-liquefaction
        
        
          Liquefaction
        
        
          Diluvial layer
        
        
          Alluvial
        
        
          clay
        
        
          Alluvial
        
        
          sand
        
        
          Reclaimed
        
        
          soil
        
        
          Land side (northwest)
        
        
          Sea side (southeast)
        
        
          0
        
        
          - 0
        
        
          0
        
        
          -30
        
        
          0
        
        
          0
        
        
          0
        
        
          -1
        
        
          -2
        
        
          -3
        
        
          -4
        
        
          -5
        
        
          -6
        
        
          Figure 2. Geological profile along line of measurement A-B-C in
        
        
          Urayasu City
        
        
          Swelling indes


          ~
        
        
          0.0001
        
        
          0.010
        
        
          0.020
        
        
          0.008
        
        
          Poisson’s ratio


          0.10
        
        
          0.10
        
        
          0.35
        
        
          0.10


              Evolution parameters


          Degradation index of structure


            a


          0.001
        
        
          0.4
        
        
          1.5
        
        
          3.0
        
        
          Ratio of


            p


            v


            D


          to


            p


            s


            D


            s


            c


          1.0
        
        
          0.3
        
        
          0.3
        
        
          0.1
        
        
          Degradation index of OC


            m


          50.0
        
        
          20.0
        
        
          0.7
        
        
          2.0
        
        
          Rotational hardening index


            br


          0.0001
        
        
          0.001
        
        
          0.5
        
        
          0.01
        
        
          Limit of rotational hardening


            b


            m


          1.0
        
        
          1.0
        
        
          0.7
        
        
          1.0


              Initial conditions


          Specific volume v
        
        
          1.70
        
        
          3.30
        
        
          2.30
        
        
          2.90
        
        
          Stress ratio
        
        
          0


          0.545
        
        
          0.545
        
        
          0.545
        
        
          0.545
        
        
          Degree of structure
        
        
          0
        
        
          *
        
        
          /1


            R


          10.0
        
        
          20.0
        
        
          15.0
        
        
          10.0
        
        
          Degree of anisotropy
        
        
          0


          0.545
        
        
          0.545
        
        
          0.545
        
        
          0.545
        
        
          Soil particle density


            s


          (g/cm3)
        
        
          2.65
        
        
          2.65
        
        
          2.65
        
        
          2.65
        
        
          Mass permeability index


            k


          (cm/s)
        
        
          1.0
        
        
          ×
        
        
          10
        
        
          -6
        
        
          5.0
        
        
          ×
        
        
          10
        
        
          -7
        
        
          5.0
        
        
          ×
        
        
          10
        
        
          -5
        
        
          1.0
        
        
          ×
        
        
          10
        
        
          -5