 
          1413
        
        
          Technical Committee 203 /


            Comité technique 203


          Swedish clays and similar soils. In Swedish practice, the plastic
        
        
          limit of the soil is seldom determined and empirical relations are
        
        
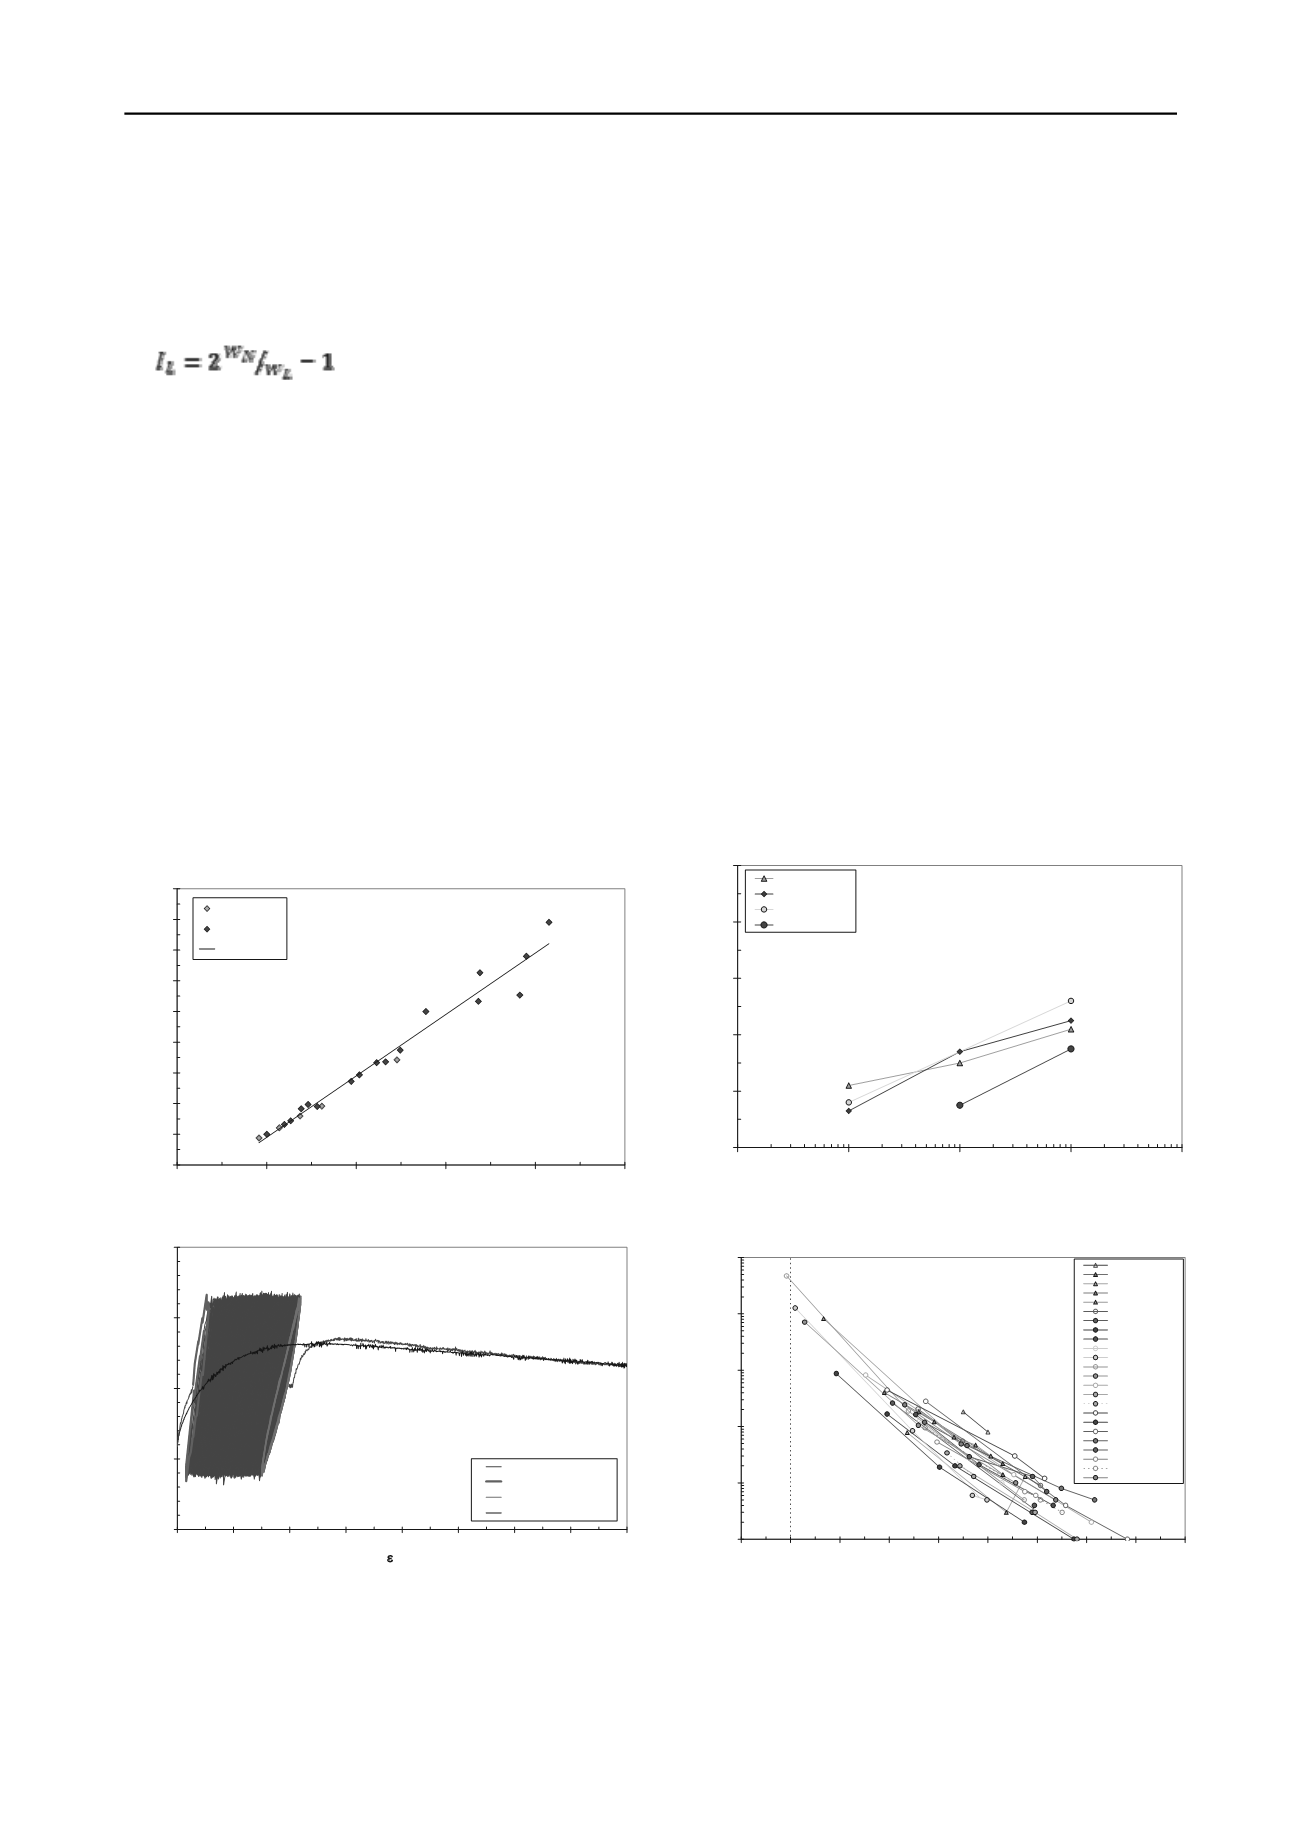
          usually linked to the liquid limit instead of plasticity index.
        
        
          Correspondingly, the liquidity index of the soil is usually
        
        
          replaced by a quasi liquidity index


            w


          N
        
        
          /


            w


          L
        
        
          . For the Swedish soils
        
        
          in this investigation, which all had water contents higher or
        
        
          equal to the liquid limit, a relation between the indices of
        
        
          (1)
        
        
          showed a high correlation, Fig.1.
        
        
          The remoulded shear strength was found to be directly
        
        
          related to the liquidity indicies. The sensitivity is the relation
        
        
          between undrained and remoulded shear strength and for a good
        
        
          correlation with a liquidity index, the value of the undrained
        
        
          shear strength should also be considered.
        
        
          The triaxial tests showed that cyclic loads or imposed
        
        
          deformations that do not cause strains larger than the failure
        
        
          strains at static loading do not cause any significant reduction in
        
        
          undrained shear strength, Fig. 2. This is in agreement with
        
        
          earlier observations by e.g. Andersen (2009). The failure strain
        
        
          at static loading, and thereby the “safe” limit, is related to the
        
        
          soil plasticity and the organic content and increases with these
        
        
          parameters.
        
        
          Rate effects entail that a limited number of cyclic loads can
        
        
          bring shear stresses higher than the static failure load without
        
        
          leading to failure. The size of the rate effects depends on the
        
        
          frequency (or duration) of the cyclic load and the soil
        
        
          properties. The frequency of wave and wind-loads is normally
        
        
          assumed to be about 0.1 Hz, which brings fairly long durations
        
        
          of the loads and moderate rate effects. Traffic and other cyclic
        
        
          Mellösa 5m
        
        
          Munkedal 10m
        
        
          1
        
        
          10
        
        
          100
        
        
          1000
        
        
          10000
        
        
          100000
        
        
          0,9
        
        
          1
        
        
          1,1
        
        
          1,2
        
        
          1,3
        
        
          1,4
        
        
          1,5
        
        
          1,6
        
        
          1,7
        
        
          1,8


            t


            max-cycl


            /c


            u


            Number of cycles to failure


          Mellösa 5m
        
        
          Mellösa 8,5m
        
        
          Norrköping 5m
        
        
          Linköping 5m
        
        
          Strängnäs 5,8m
        
        
          Torpa 3,5m
        
        
          Torpa 5,5m
        
        
          Torpa 8m
        
        
          Fråstad 6,5m
        
        
          Onsjö 3,6m
        
        
          Onsjö 7m
        
        
          Äsperöd 2,7m
        
        
          Äsperöd 7m
        
        
          Kattleberg 4,5m
        
        
          Kattleberg 8m
        
        
          Kattleberg 8m II
        
        
          Munkedal 5m
        
        
          Munkedal 10m
        
        
          Gläborg 4,5m
        
        
          Gläborg 6m
        
        
          Gläborg 10m
        
        
          Fultaga 6.5m
        
        
          Fultaga 6.5m II
        
        
          Fultaga 10,3m
        
        
          Figure 1.  Correlation between liquidity index and quasi liquidity index.
        
        
          Figure 2. Example of measured stress-strain response in cyclic triaxial
        
        
          tests with the specimen after 1000 cycles subjected to a rest period of 1
        
        
          hour followed by static shearing as compared to that measured in an
        
        
          ordinary static test.
        
        
          construction loads are normally assumed to have frequencies of
        
        
          about 1 Hz, which gives higher rate effects, and blasting
        
        
          normally gives vibrations with even higher frequencies, Fig.3.
        
        
          The size of the rate effects is also influenced by the same
        
        
          parameters that affect creep rates, which are linked to the void
        
        
          ratio of the soil, (e.g. Larsson 1986). The rate effects thus
        
        
          increase with increasing void ratio. Since the void ratio in soft
        
        
          clays is more or less linked to the liquid limit, this generally
        
        
          means that the rate effects increase with increasing plasticity,
        
        
          but the relation is complex and depends on more factors.
        
        
          At continued stress-controlled cyclic loading after passing
        
        
          the static failure strain, the build- up of strains and pore pressure
        
        
          accelerates and failure occurs after roughly about twice the
        
        
          static failure strain. There is a certain scatter in the results, but
        
        
          the real failure strain and the margin between passing the static
        
        
          failure strain and actual failure at cyclic loading generally
        
        
          increase with mainly plasticity and organic content.
        
        
          The cyclic stress level leading to failure at a certain number
        
        
          of load cycles and the number of cycles leading to failure at a
        
        
          certain cyclic stress level both increased with decreasing
        
        
          sensitivity and increasing organic content. For a given clay, the
        
        
          relation between cyclic stress level and log number of cycles to
        
        
          failure is fairly linear, Fig. 4.
        
        
          The strain-controlled tests showed that both the total
        
        
          decrease in maximum shear stress in the cycles passing the
        
        
          static failure strain, Figure 5, and the rate for this degradation,
        
        
          Figure 6, generally increased with sensitivity and the
        
        
          corresponding liquidity indices. Both types of tests also showed
        
        
          that clays with embedded loose silt layers can rapidly lose their
        
        
          strength. The same can be assumed for clays with embedded
        
        
          loose sand layers. The tests showed that both static and cyclic
        
        
          strains are larger in organic soils, but on the other hand they can
        
        
          withstand cyclic loads and large deformations better than clays.
        
        
          This is in agreement with earlier findings by e.g Vucetic (1994).
        
        
          1
        
        
          Figure 3. Influence of frequency on stress level leading to failure after
        
        
          10 cycles at stress-controlled loading
        
        
          Figure 4. Relation between cyclic stress level and number of cycles to
        
        
          failure in stress-controlled tests.
        
        
          1,2
        
        
          4
        
        
          6
        
        
          8
        
        
          2
        
        
          0,001
        
        
          0,01
        
        
          0,1
        
        
          1
        
        
          10


            Frequency, Hz


            t


            cycl


            /c


            u


            (cycles to fa


            0)


          Torpa 5,5m
        
        
          y = 2,00x - 1,02
        
        
          R
        
        
          2
        
        
          = 0,97
        
        
          0,8
        
        
          1,0
        
        
          1,2
        
        
          1,4
        
        
          1,6
        
        
          1,8
        
        
          2,0
        
        
          2,2
        
        
          2,4
        
        
          2,6
        
        
          0,8
        
        
          1,0
        
        
          1,2
        
        
          1,4
        
        
          1,6
        
        
          1,8


            w


            N


            /w


            L


            I


            L


            , %


          East coast clay
        
        
          West coast clay
        
        
          linear (all data)
        
        
          Äsperöd 7m
        
        
          1,
        
        
          1,
        
        
          1,


            ilure=1


          Munkedal 5m
        
        
          Munkedal 10m
        
        
          0
        
        
          5
        
        
          10
        
        
          15
        
        
          20
        
        
          0
        
        
          1
        
        
          2
        
        
          3
        
        
          4
        
        
          5
        
        
          6
        
        
          7
        
        
          8


            a


            , %


            t, kPa


          Mellösa 5m-m2-P6-cycl2
        
        
          1 cycl.
        
        
          1000 cycl.
        
        
          Mellösa 5m-m2-P3-static


            Mellösa clay


            5 m