1417
Technical Committee 203 /
Comité technique 203
Proceedings of the 18
th
International Conference on Soil Mechanics and Geotechnical Engineering, Paris 2013
-1.6
-1.2
-0.8
-0.4
0
0.4
0.8
1.2
1.6
Output Voltage (mV)
-12
-9
-6
-3
0
3
6
9
12
0
500
1000
1500
2000
2500
3000
Input Voltage (V)
Time (μs)
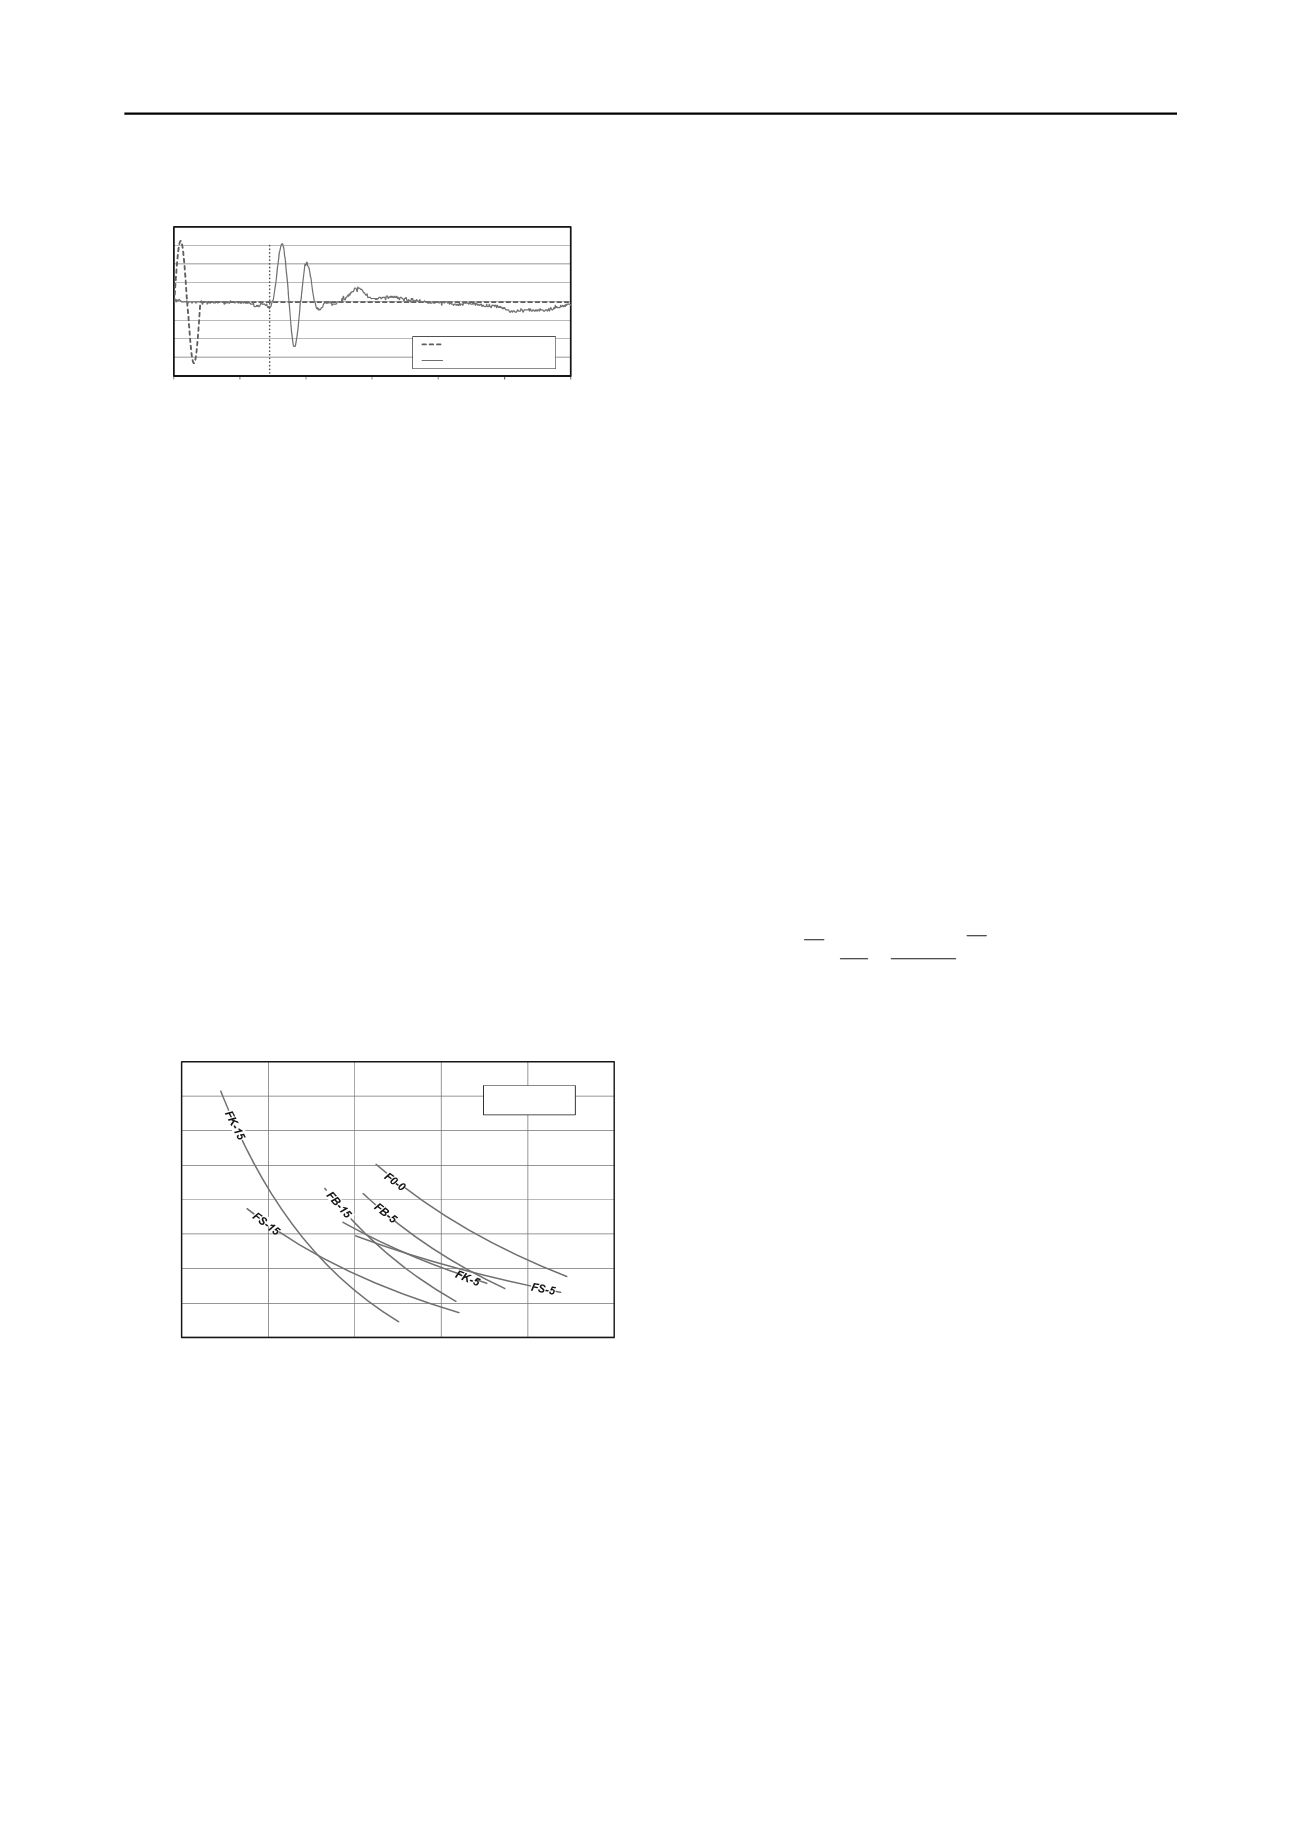
Source Signal
Receive Signal
Sample : 5% Bentonite (FB-5)
σ'
m
: 120 kPa
Frequency : 5kHz
e=0.755
ArrivalTime = 722.8
μ
s
Figure 3. Representative result of bender element tests
The small-strain shear modulus (G
0
) can be determined from
shear wave velocity, according to the theory of elasticity, using
Equation 2. In this equation ρ is the total density of the soil.
2
s
0
V G
(2)
G
0
of a granular soil is a function of its void ratio and
effective confining stress, and can be obtained from the
empirical equation developed by Jamiolkowski et al. (1991), as
introduced in the following equation.
g
g g
n
m
a n1
Ag
0
e PC G
,
v
0
m
3/)K21(
(3)
where P
A
is a reference stress equal to 100 kPa, σ’
m
is mean
effective stress, σ’
v
is vertical effective stress, K
0
is the ratio of
effective horizontal stress to effective vertical stress and a
g
, n
g
and
C
g
are intrinsic parameters associated with each type of soil
material.
The intrinsic parameters of Equation 3 for tested materials
were obtained by fitting the results of the bender element tests
obtained for different consolidation stresses and void ratios and
are listed in Table 2. The values of correlation coefficient, R
2
,
for all tested materials are very close to 1.0, indicating that the
correlation is satisfactory. Using the Equation 3 and these
intrinsic parameters, G
0
versus void ratio in isotropic
consolidation stress of 100 kPa are presented in Figure 4.
30
40
50
60
70
80
90
100
110
0.45
0.55
0.65
0.75
0.85
0.95
G
0
(MPa)
e (Void Ratio)
s
'
m
=100 kPa
Figure 4. G
0
versus void ratio for tested soils
3 CONVERSION OF LABORATORY DATA TO FIELD
CONDITIONS
Both the cyclic resistance and the V
s
values measured in the
laboratory must be corrected to represent the field conditions.
In a triaxial test, K
0
is equal to 1, but for saturated normally
consolidated sand in the field, K
0
is generally between 0.4 and
0.5. In addition, seismic excitations in the field are multi-
directional, while in a cyclic triaxial test, the cyclic load is
applied in only one direction. Therefore, to account for these
differences, the liquefaction resistance of the soil obtained from
cyclic triaxial tests should be corrected. Several equations have
been suggested in the literature regarding such corrections. In
this study, the widely accepted Equation 4 proposed by Seed
(1979) was used in this respect.
tx
0
CRR 3/)K21(9.0 CRR
(4)
where CRR is the actual liquefaction resistance in the field. On
the other hand, according to Equations 3, the actual on-site
small-strain shear modulus (G
0field
) can be modified by the
following equation to consider the effects of K
0
.
tx01
n
0
01
G3/)K21(
G
g
(5)
where G
01
is the small-strain shear modulus at a vertical
effective stress of 100 kPa in the field, and G
01tx
is the small-
strain shear modulus obtained in the laboratory at an effective
confinement stress of 100 kPa.
4 CORRELATION BETWEEN LIQUEFACTION
RESISTANCE AND SHEAR WAVE VELOCITY
Using Equations 1 to 5, and eliminating the void ratio, the
correlation between the field V
s
at vertical effective stress of
100 kPa (V
s1
) and the field liquefaction resistance (CRR) can be
established:
c
c
n2
1s
1
Ac
n
01
1
Ac
)V PK(
)GPK(
CRR
(6)
All parameters in Equation 6, except K
c
and n
c
have been
defined previously. These parameters are defined as:
g
g
g
n
a
0
g
a
c
3
K21
.
C
1 . ) 9.0( K
(7)
g
c
a/
n
(8)
Using Equation 6 and having the required values of intrinsic
parameters for G
0
(a
g
, n
g
and C
g
) and for liquefaction resistance
ratio (
and
), the intrinsic parameters for CRR-V
s1
correlation (K
c
and n
c
) can be obtained for any soil type.
Assuming K
0
to be 0.5, the CRR-V
s1
correlation intrinsic
parameters were obtained and are presented in Table 2.
Like CPT- and SPT-based methods, a minimum CSR is
considered as a threshold for the beginning of pore pressure
build up. In this study, for conservatism, Equation 6 can be used
for CSR>0.03 and below this value, independent of V
s1
, soil is
considered non-liquefiable. The developed CRR-V
s1
curves
using Equation 6 are plotted separately for sand with FC≤5%
and FC=15% in Figure 5 and 6, respectively. The data obtained
from experiments (modified for field conditions) are also
presented in these figures. It can be seen that there is a good
correlation between V
s
and liquefaction resistance for a
specified soil. For a constant fines content, CRR-V
s1
curves
vary depending on the plasticity of fines. Therefore, it can be
concluded that the CRR-V
s1
correlation depends on fines nature
in addition to fines content.
In Figure 5 and 6, the curves proposed by Andrus and Stokoe
(2000) are also presented for comparison. It worth noting that,
the procedure developed by Andrus and Stokoe (2000) is based
on field performance data and in situ V
s
measurements.


