1422
Proceedings of the 18
th
International Conference on Soil Mechanics and Geotechnical Engineering, Paris 2013
B’, which was not liquefied in the case of the one-dimensional
model studied in section 2. The horizontal and vertical
accelerations after the seismic wave passed through the alluvial
clay layers (alluvial clay/alluvial sand boundaries) are shown in
Fig. 9. There is not much difference in the horizontal
accelerations when compared with those obtained through one-
dimensional analysis. On the other hand, although there is
almost no vertical acceleration response at location A’, where
the effect of the sloped stratum is small, vertical accelerations of
up to about 10 gal have been generated at sloped locations B’
and C’. The nonuniform, localized shear strain and excess pore
water pressure ratio distributions illustrated in Figs. 7 and 8 are
due to the input seismic wave being amplified in the clay layer
(as explained in section 2) and the existence of the sloped
boundary between the alluvial clay and diluvial layers, as shown
through the analysis carried out in this section. In other words,
in addition to the vertical component of seismic movement
being generated by the stratum slope, multi-dimensional
propagation is also exhibited because of complex reflection
behavior in the diluvial layer. Moreover, in sloped layers such
as location B’, the danger of liquefaction is increased compared
with the one-dimensional model. The actual liquefaction
damage observed in Urayasu City was heavy in the sloped
stratum locations where midterm reclamation work had been
executed (mid-part of Fig. 1). This behavior resembles the
results of the analysis carried out here. The current analysis
shows that even in the case of homogeneous geomaterials,
stratigraphic nonhomogeneity results in large variations in
ground deformation behavior and that such deformation
becomes particularly large in sloped strata locations. These
things cannot be taken into consideration in one-dimensional
analysis and highlight the necessity of performing multi-
dimensional effective stress analysis.
6,000m
2,400m
1,800m
300m
300m
Magnified
A’
B’
C’
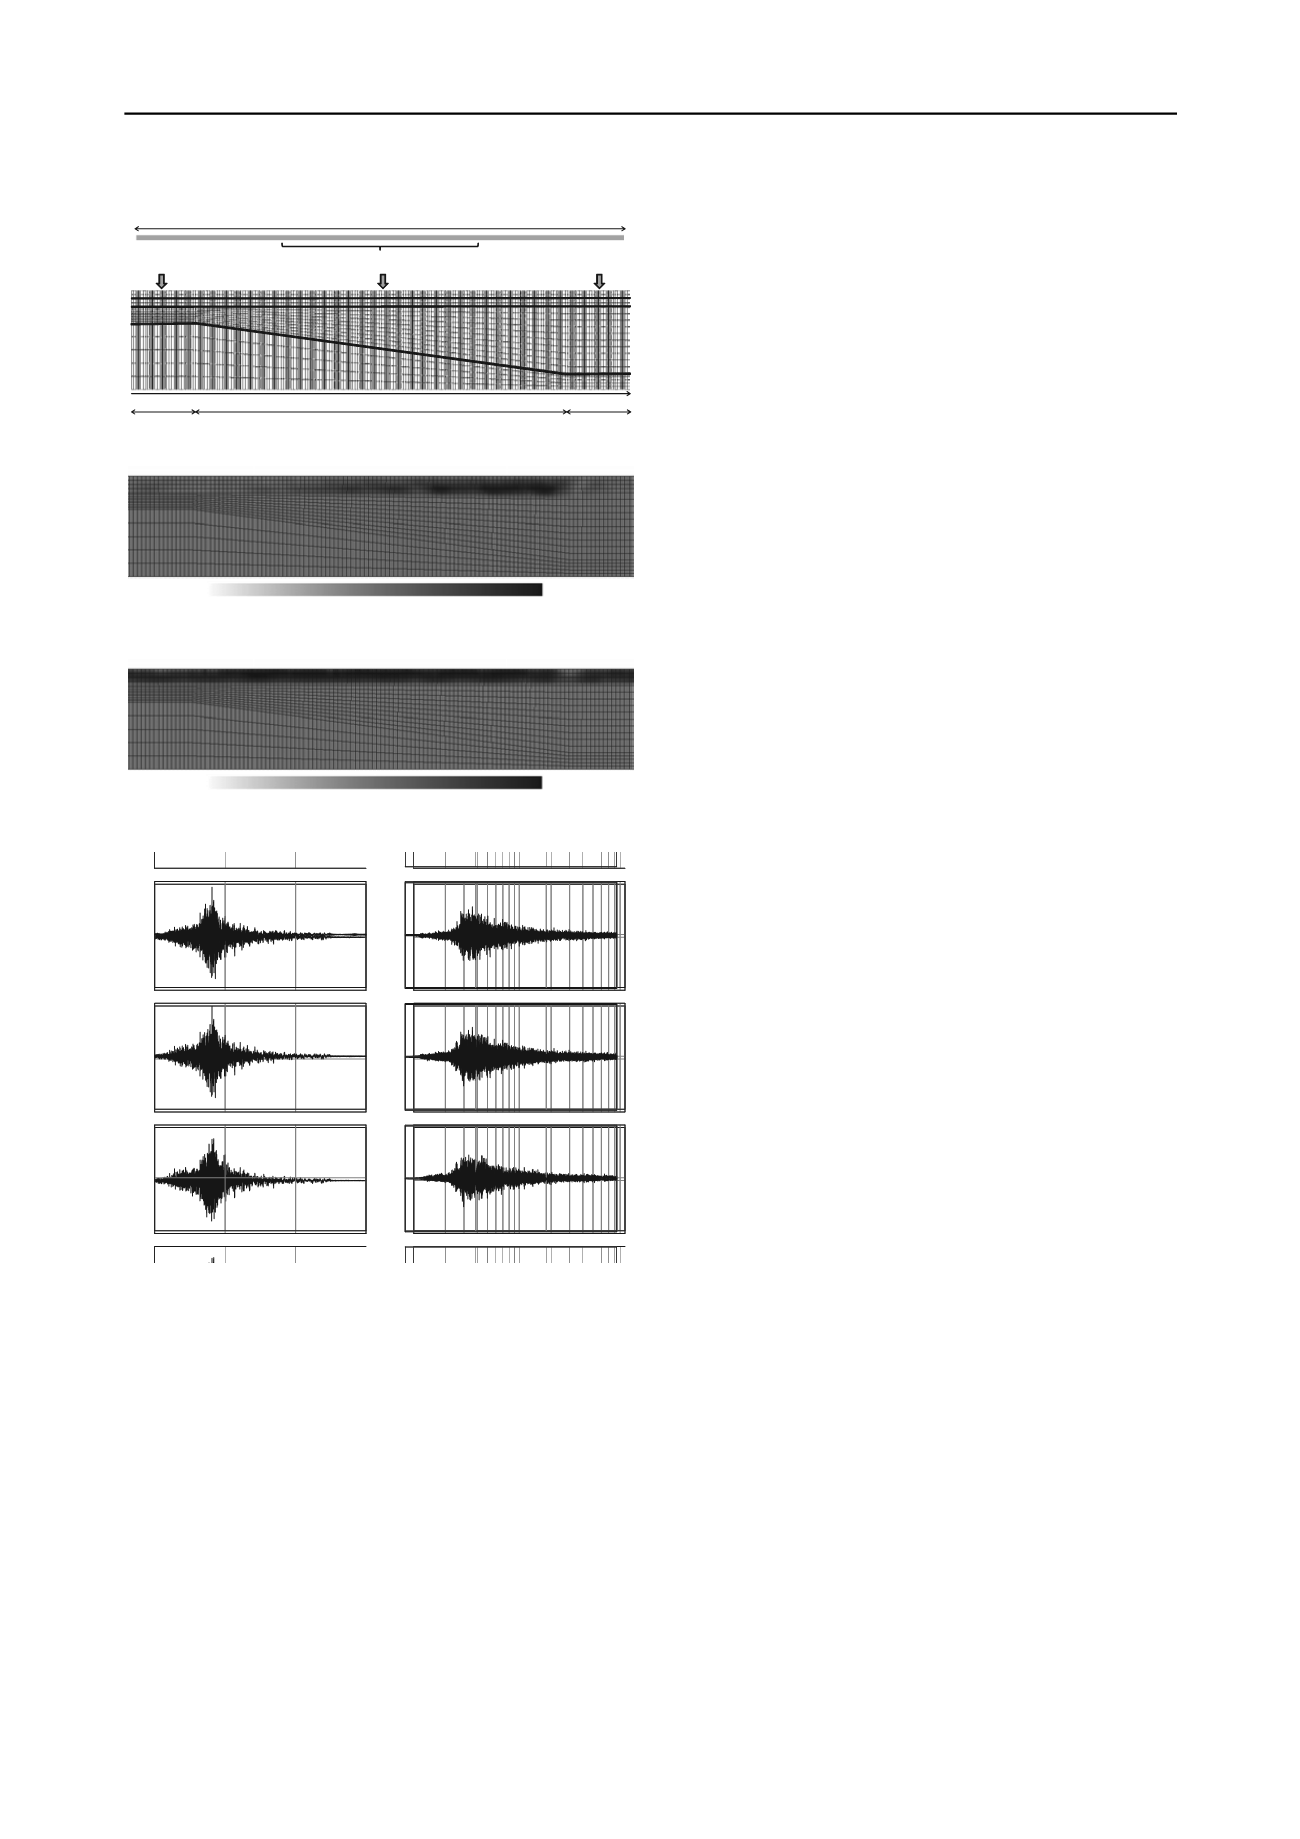
Figure 6. Finite element mesh used for the analysis
0%
1%
Figure 7. Shear strain distribution 150 seconds after the start of the
earthquake
0.6
0.95
Figure 8 Excess pore water pressure distribution 150 seconds after the
start of the earthquake
0
- 100
0
200
- 100
0
100
0
150
- 100
0
100
10
-1
10
0
10
1
0
150
0
100
200
300
- 100
0
100
Period (sec)
4 CONCLUSIONS
Elasto-plastic seismic response analysis was carried out with
respect to a multi-layered ground, focusing attention on the
existence and slope of a clay layer deposited in the ground
deeper than the liquefied layer. The results showed that the
existence of the clay layer caused amplification of the seismic
wave in the somewhat long-period ranges, leading to large
plastic strains sufficient to cause liquefaction even in
intermediate soils. In addition, it was shown that because of the
existence of the sloped boundaries in the deep part of the
ground, localized shear strains become prominent in the
inclined strata and cause nonuniform liquefaction to occur in the
ground. Although the materials/conditions of the ground studied
here were not homogeneous, depending on the organization and
slope of the strata, localized and nonuniform ground
deformation could occur even in the case of homogeneous
grounds. The factors mentioned above can be considered to
have contributed to the heavy and nonuniform liquefaction
damage observed in Urayasu.
5 ACKNOWLEDGEMENTS
The seismic wave input for the current study was obtained from
the public database of the Strong-Motion Seismograph Network
(KiK-net) of the National Research Institute for Earth Science
and Disaster Prevention, and boring data obtained from the
Chiba Prefecture Geological Environment Information Bank
were used to assess the geological cross section of the ground.
The authors wish to express their grateful thanks to these two
institutions for providing the data. The authors would also like
to extend their gratitude to the Ground Deformation Mechanism
Research Committee of the Japanese Geotechnical Society for
their kind cooperation in carrying out the current study.
6 REFERENCES
Nikkei Construction 2011. Lessons learnt from the Great East Japan
Earthquake (The complete story of damage to infrastructures), 102-
116. (in Japanese)
Asaoka et al. 2002. An elasto-plastic description of two distinct volume
change mechanisms of soils. S&F, 42 (5), 47-57.
Noda et al. 2008. Soil-water coupled finite deformation analysis based
on a rate-type equation of motion incorporating the SYS cam-clay
model. S&F, 48 (6), 771-790.
Noda, T. et al. 2010. Modeling and Seismic Response Analysis of a
Reclaimed Artificial Ground. ASCE Spec. Pub., No. 201, 294-299.
Noda, T. et al. 2009. Co-seismic and post-seismic behavior of an
alternately layered sand-clay ground and embankment system
accompanied by soil disturbance. S&F, 49 (5), 739-756.
Lysmer, J. and R.L. Kuhlemeyer 1969. Finite dynamic model for
infinite media. ASCE, 95 (EM4), 59-877.
Asaoka et al. 2011. Effect of organization of deep strata on liquefaction
of sandy surface layers with large fine fraction content. Program
and Abstracts of the 2011 Fall Meeting of the Seismological
Society of Japan, pp.56.
Fou
Time (sec)
Fourier Amplitude (gal*s)
Acceleration (gal)
Fourier Amplitude (gal*s)
Acceleration (gal)
Fourier Amplitude (gal*s)
Acceleration (gal)
0
200
- 100
0
100
0
200
- 100
0
100
0
150
- 100
0
100
150
100
Fourier Amplitude (gal*s)
A celeration (gal)
Fourier Amplitude (gal*s)
A celeration (gal)
Fourier Amplitude (gal*s)
A celeration (gal)
l*s)
- 20
0
20
- 20
0
20
- 20
0
20
20
- 20
Acceleration (gal)
Acceleration (gal)
Acceleration (gal)
-
0
100
200
300
0
Time (sec)
Ac ler tion (gal)
Ac tio (g )
A io g l)
Horizontal acceleration
Vertical acceleration
Location A’
Location B’
Location C’
Location A’
Locatio
Location C’
n B’
Figure 9. Horizontal and vertical acceleration after the seismic wave
passed through the alluvial clay layers at locations A’, B’, and C’


