1436
Proceedings of the 18
th
International Conference on Soil Mechanics and Geotechnical Engineering, Paris 2013
Figure 1a. The test setup Figure 1b. A typical test result
Remarkably, in the early stage of sedimentation the mud
weight causes high excess pore pressures everywhere, nearly
two times the hydrostatic pressure, see Figure 1b. A typical test
shows a maximum pore pressure gradient of 18.8 kPa/m, at the
beginning, representing a mud weight of 18.8 kN/m
3
. The
induced excess pressures dissipate in a way similarly to
hindered sedimentation and consolidation, as described by Pane
& Shiffman (1985), including Kynch's theory. Although the
process locally is highly nonlinear, the period of sedimentation
is about proportional to the square of the dissipation path.
Therefore, we could define a global sedimentation coefficient,
which attains the following value for this material:
s
v
=
(0.5)
2
/7x60
0.6 10
-3
m
2
/s. In the field the sedimentation time
can be roughly obtained with this coefficient for a similar
material of thickness
h
reaching full sedimentation, by using
concepts of the consolidation theory, such as
t
= 2
h
2
/
s
v
.
2.2
1D liquefaction effect of packing and trigger
As shown in Section 2.1, during liquefaction large excess
pore pressures can exist. It is of interest how these excess
pressures proceed in an adjacent densely packed sand
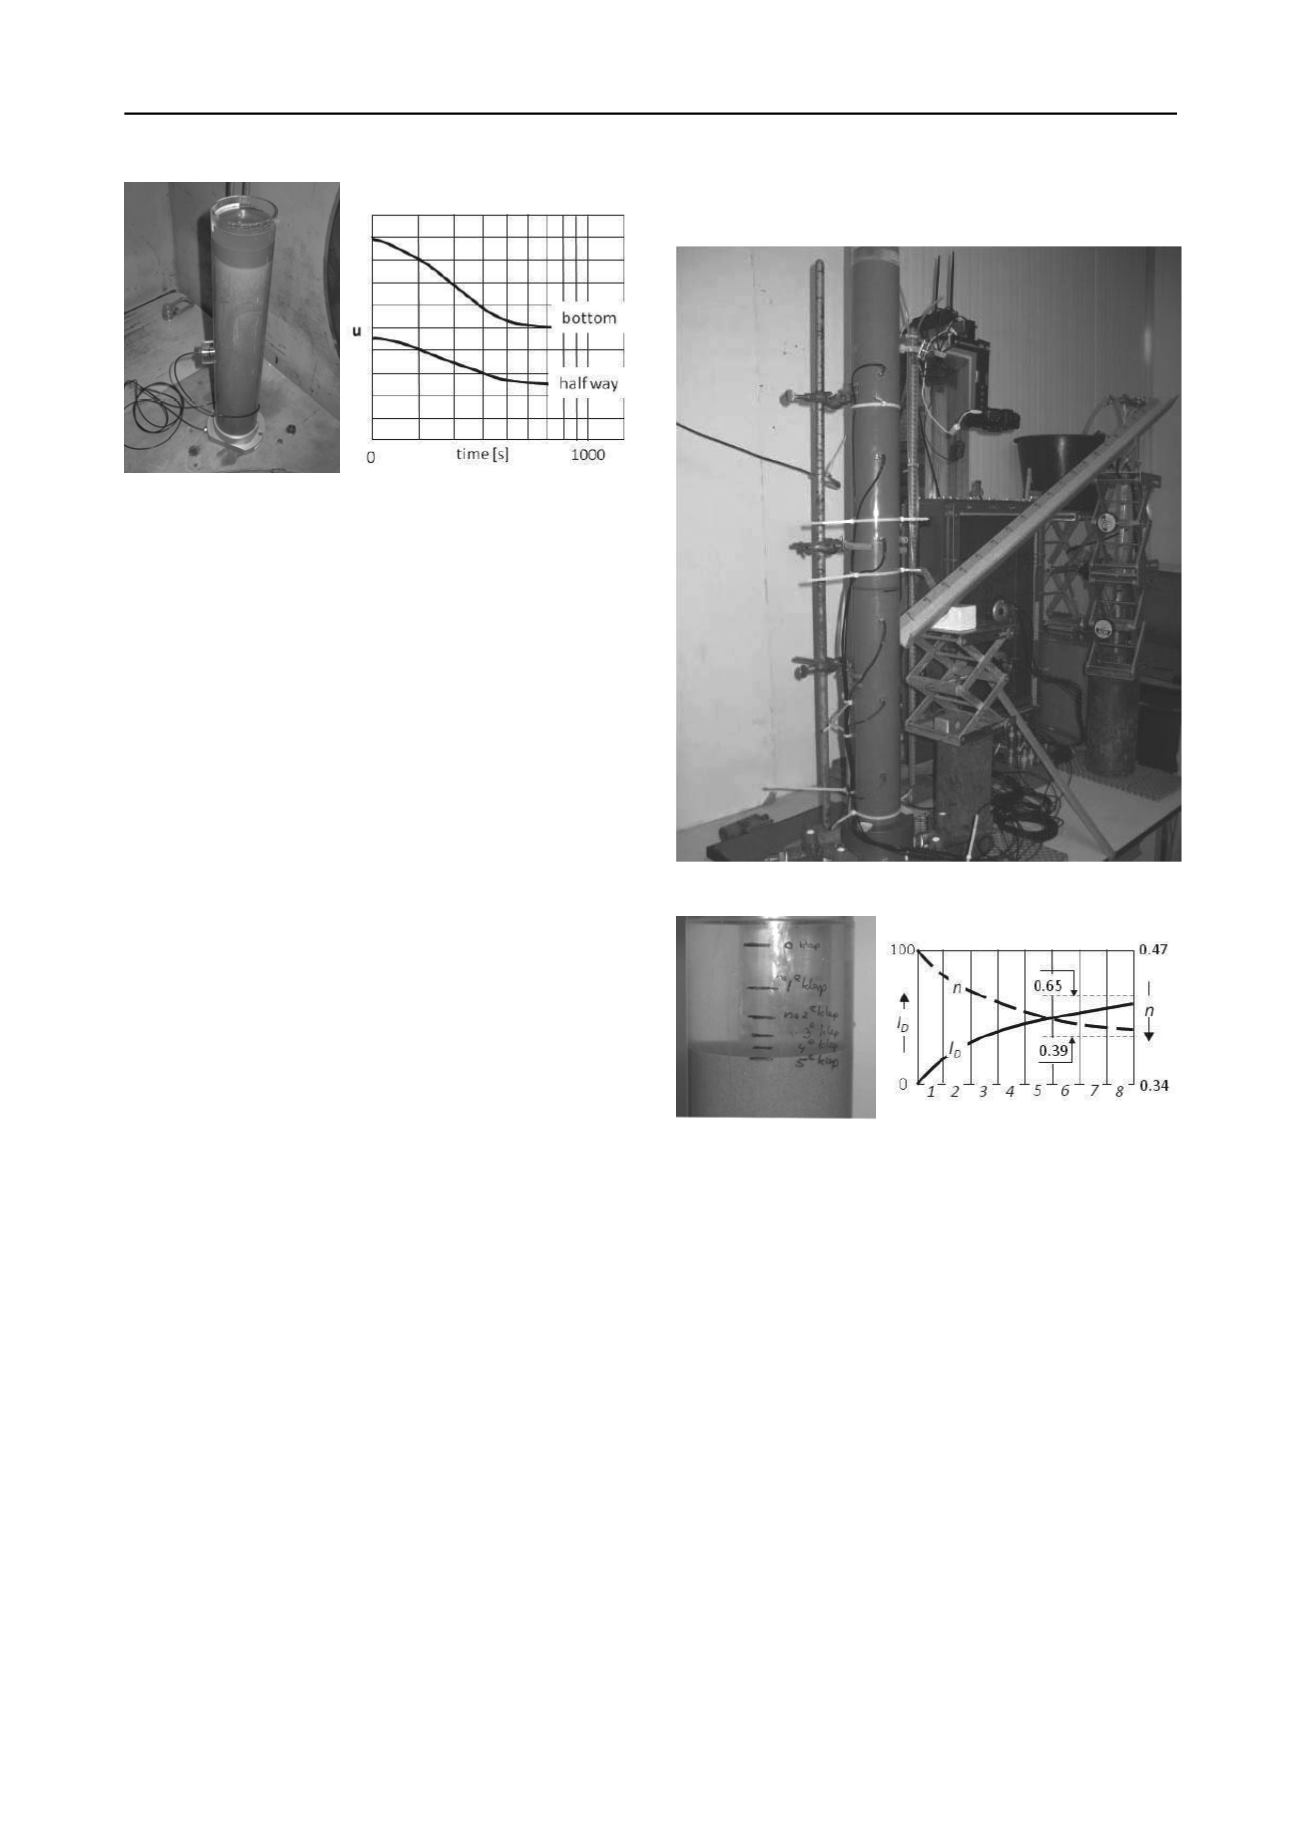
formation. In a 1D column test of 100 cm height and 6.5 cm
diameter, equipped with six sensors at 12.5 cm sequential
distance, recording total pore pressures at a sampling rate of
200 Hz, a two layer sand system was prepared with fully
saturated Baskarp B15 sand (
n
min
= 0.34,
n
max
= 0.47,
s
= 26
kN/m
3
). The bottom layer of 42 cm high was placed at a high
uniform density at
n
0.34, and the top layer of 50 cm high was
produced at a very low uniform density at
n
0.47, see Figure
4. The separation between the loose and dense formation was
marked by a thin disc of colored sand, see Figure 2. Care was
taken to eliminate any air intrusion.
Several test series have been performed. The trigger for
liquefying the top layer was produced by rolling a bullet of
0.066 kg over a inclined (20
o
) gutter impacting the column at
about 30 cm height (Figure 2) The intensity of the trigger was
changed by the rolling height (from a distance of 5 up to 100 cm
over the sloping gutter). After every impact the top level
lowering of the loose sand has been measured (Figure 3a). The
lower dense sand layer showed practically no densification
change, and in the very beginning of every hit some dilatancy
(negative excess pore pressures). The intensity of the trigger
showed full liquefaction of the loose top layer for a bullet
impact after rolling over more than 50 cm over the gutter, for
lesser the trigger intensity was too small to invoke complete
liquefaction, but excess pore pressures were observed. Next,
repeated hits of sufficient intensity showed full liquefaction of
the top sand layer each time, followed by sedimentation and
consolidation, at a decreasing tendency. The corresponding
porosity
n
and the relative density
I
D
was determined after each
hit (Figure 3b). Many impacts should reach a critical density of
n
crit
0.39 or relative density
I
D
65% (Lindenberg & Koning
1981, Poulos 1971).
Figure 2. The test setup
Figure 3a. Top level lowering Figure 3b. Effect at successive hits
The top three sensors (nr 1, 2 and 3), located in the loose
sand, showed constant high pore pressure during liquefaction,
see Figure 4. The effect of hindered dispersion during
sedimentation is noticed by a regular decrease of the pore
pressures. Similar related high pore pressures are noticed also
in lower sensors, nr 4, 5 and 6, all in the dense sand, also
decreasing in accordance with the sedimentation process of the
liquefied layer on top. After completion of the sedimentation a
hydrostatic situation is restored.
For several hits, sand settlement due to sedimentation is
shown in Figure 3a. As it seems, subsequent hits produced a
sedimentation period that seems each time about 25% shorter
than the previous one. The mud weight was about 18 kN/m
3
.
The sedimentation coefficient (defined in Section 2.1) for the
case shown in Figure 4 is:
s
v
1.5 10
-3
m
2
/s. The slight decline
of the constant pore pressure during liquefaction phase observed
in the top sensors is due to mud passing the sensor during
sedimentation. The tests reveal that during partly liquefaction
corresponding excess pore pressures extend outside the
liquefied zone, and remain high during the sedimentation, In
these tests about two minutes. Thicker layers may show
significantly longer sedimentation time.


