1444
Proceedings of the 18
th
International Conference on Soil Mechanics and Geotechnical Engineering, Paris 2013
of the building in the absence of the boundary conditions.
Lowest eigenfrequency period was determined to be T=0.56 s.
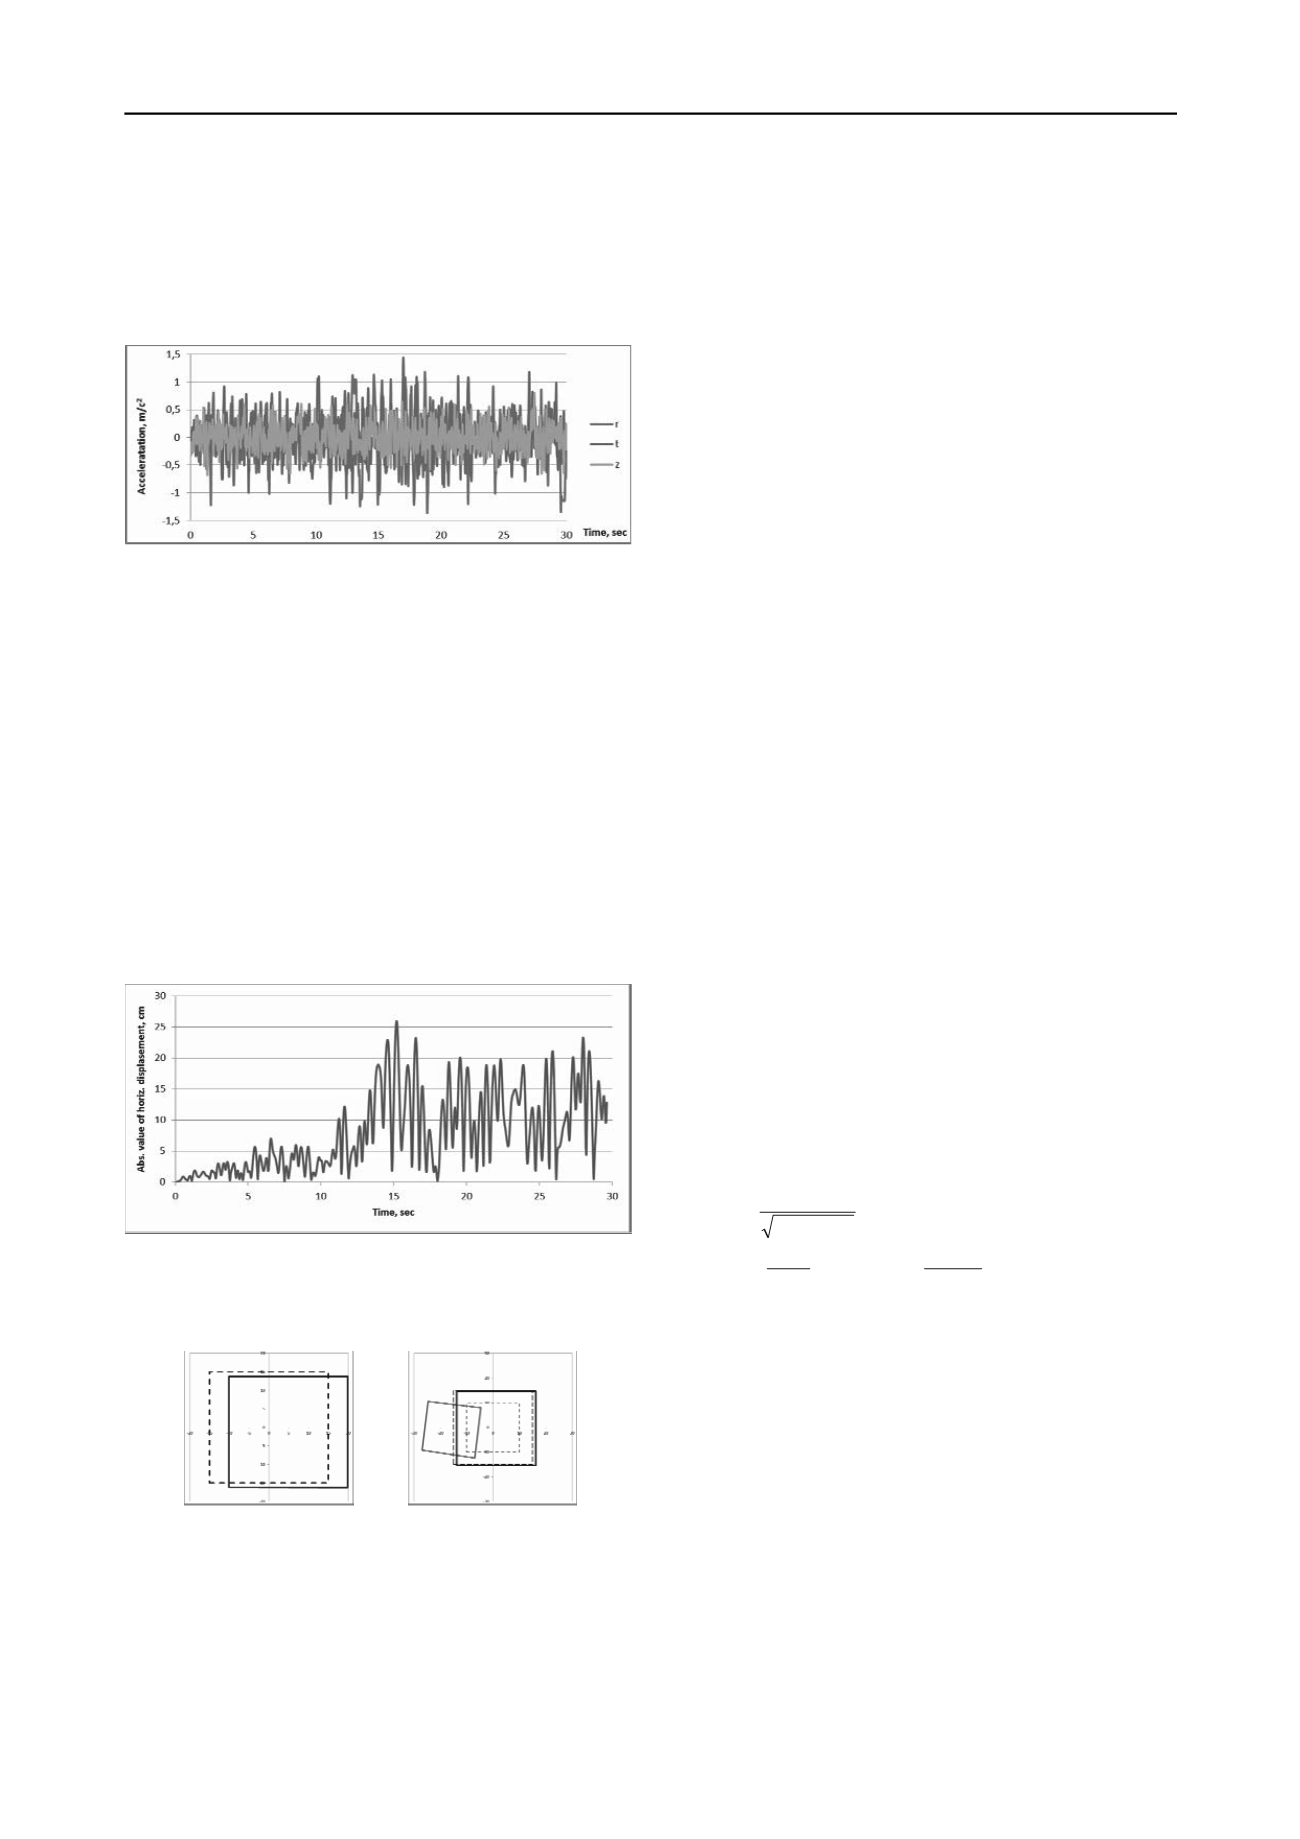
Given the conditions above, normalized 30 second plot of the
accelerogram No. 3 from the standard accelerogram set
(ДБН В.1.1-12-2006) was used to model seismic activity
(Fig. 2).
Figure 2. Three-dimensional calculational accellerogram (30 sec).
1.2
Construction modelling under dynamic loads with elastic
and viscoelastic components.
In order to identify the physical processes that occur due to
attenuated oscillations, the initial stage of the interaction
analysis within the system “soil base - foundation - building”
was performed using a linear model.
Under inertial forces due to the applied accelerogram, the
building experienced significant oscillation both horizontally
and vertically. Spatial movement analysis has shown that most
movements occurred in the same direction as interial forces
caused by the accelerogram (including building subsidence).
Looking at graph of the absolute value of the displacement
vector magnitudes (Fig. 3) it is clear that under load the building
experiences an increase in oscillation amplitude. Such increase
could be interpreted as a consequence of resonant processes
within the system.
Figure 3. The diagram of absolute value of displacements for grillage
slab in plane (elastic model without attenuation).
During load the maximum horizontal deviation of the
grillage slab reached 26 cm at 15.1 seconds (Fig. 3), (Fig. 4, a).
a.
b.
Figure 4. Maximal displacements in plane: a - of the grillage slab in the
moment of time t=15.1 s (the coefficient of deformation increasing
Kd=20); b – of the foundation and the covering plate t= 17.65 s, Kd=5)
Since the vertical load bearing structures consist mainly of
the internal column (with elevator shaft) and outside columns,
the building does not have high spatial rigidity. Due to the
horizontal vibration and considerable height of the building, the
upper floor experienced significantly higher oscillation
magnitudes, reaching 341 cm and 297 cm at 17.65 s and 25.38 s
respectively. Placing the rigidity core of elevator shaft near the
building edges leads to twisting during oscillation (Fig. 4, b).
Taking into account that the oscillation of the whole system
does not weaken over time, forces within the building would be
at maximum - especially where resonance effect is manifested.
Further analysis shows that, under dynamic load, the maximum
forces are concentrated around zones with maximum rigidity -
namely the core column with elevator shaft, diaphragm and
outside columns. For this setting maximum forces start to
appear after 15 seconds of load.
Vertical forces that appear in piles have alternating direction
with compression forces reaching 20
10
3
kN and tensile forces
reaching 19
10
3
kN. According to the design, the piles have
sufficient length to transmit the load into the argilite soil layer,
crossing the weaker soil.
Forces within the piles reach their maximum values at
around 16 seconds, which correlates well with observations in
the rest of the foundation. In reality, propagating waves will
experience energy loss due to viscosity, plasticity or destruction
of the medium. Thus, for a more precise assessment of the
stress-strain state it is important to consider oscillation
attenuation.
Currently there are several mathematical models that allow
modeling of oscillation damping. Ukrainian design standards
have only general recommendations with regard to the model
selection. However, the American standard for nuclear power
plant design (ASCE Standard 4-98, 1999) recommends to use
one of the (four) specific models for taking into account seismic
load - including Rayleigh’s two-parameter damping model.
According to it, the attenuation matrix is a linear combination of
mass and stiffness matrices, taken with the corresponding
coefficients α and β (Eq.1)
] [ ] [ ] [
K M C
(1)
The implementation of this model relied on determining
coefficients α and β through the damping parameters (
sum
,
M
,
K
), which are dependent on the selected natural frequencies
0
,
1
and the logarithmic decrement oscillations
(Eq. 2), (Eq. 3).
Oscillation attenuation differs between soil and reinforced
concrete engineering structures - thus each of mediums used
different attenuation. Logarithmic decrement were set according
to Ukrainian standard values which are
=0.3 for the reinforced
concrete engineering structures and
=0.6 for soil.
M K
sum
2
2
4
(2)
2
,
2
1
0
K
M
(3)
Given that the calculation model relied on several
attenuation parameters, Newmark’s direct integration method
was chosen to solve the problem.
While the system load remained unchanged, calculations
showed that accounting for attenuation process significantly
affected not only the oscillation amplitude values, but the
deformation characteristics of the whole structure. Movement
amplitude decreased by a factor of 4, reaching 8.2 cm for
grillage slab after 13.8 s of load (Fig. 5).
Vertical oscillation amplitude relative to the initial position
did not exceed 4 cm.
Maximum moments arising in the grillage slab were also
concentrated within other load bearing elements (interior load-
bearing column, diaphragms and columns) during the time
period from 10 s to 24 s.


