1441
sands. The small densification of 0.6% which was observed for
the dense sand is attributed mainly to the high initial density of
the sample. For the loose sand sample there is a significant
reduction in voids ratio leading to a densification of 5.5%
6.3 Effects of increasing peak stress ratio
Cyclic stressing with 90
changes in the principal stress
directions on granular materials, described in the previous
Sections, suggested that the granular media behaves as a linear
and elastic material after a large number of cycles (e.g. 100).
0 10 20 30 40 50 60 70 80 90 100
No. of cycles
-1
0
1
2
3
s
0
1
2
v
(%)
0 10 20 30 40 50 60 70 80 90 100
R
max
=4.33
R
max
=4.0
(%)
Test no. : D-290
Volumetric strain
Shear strain
(a)
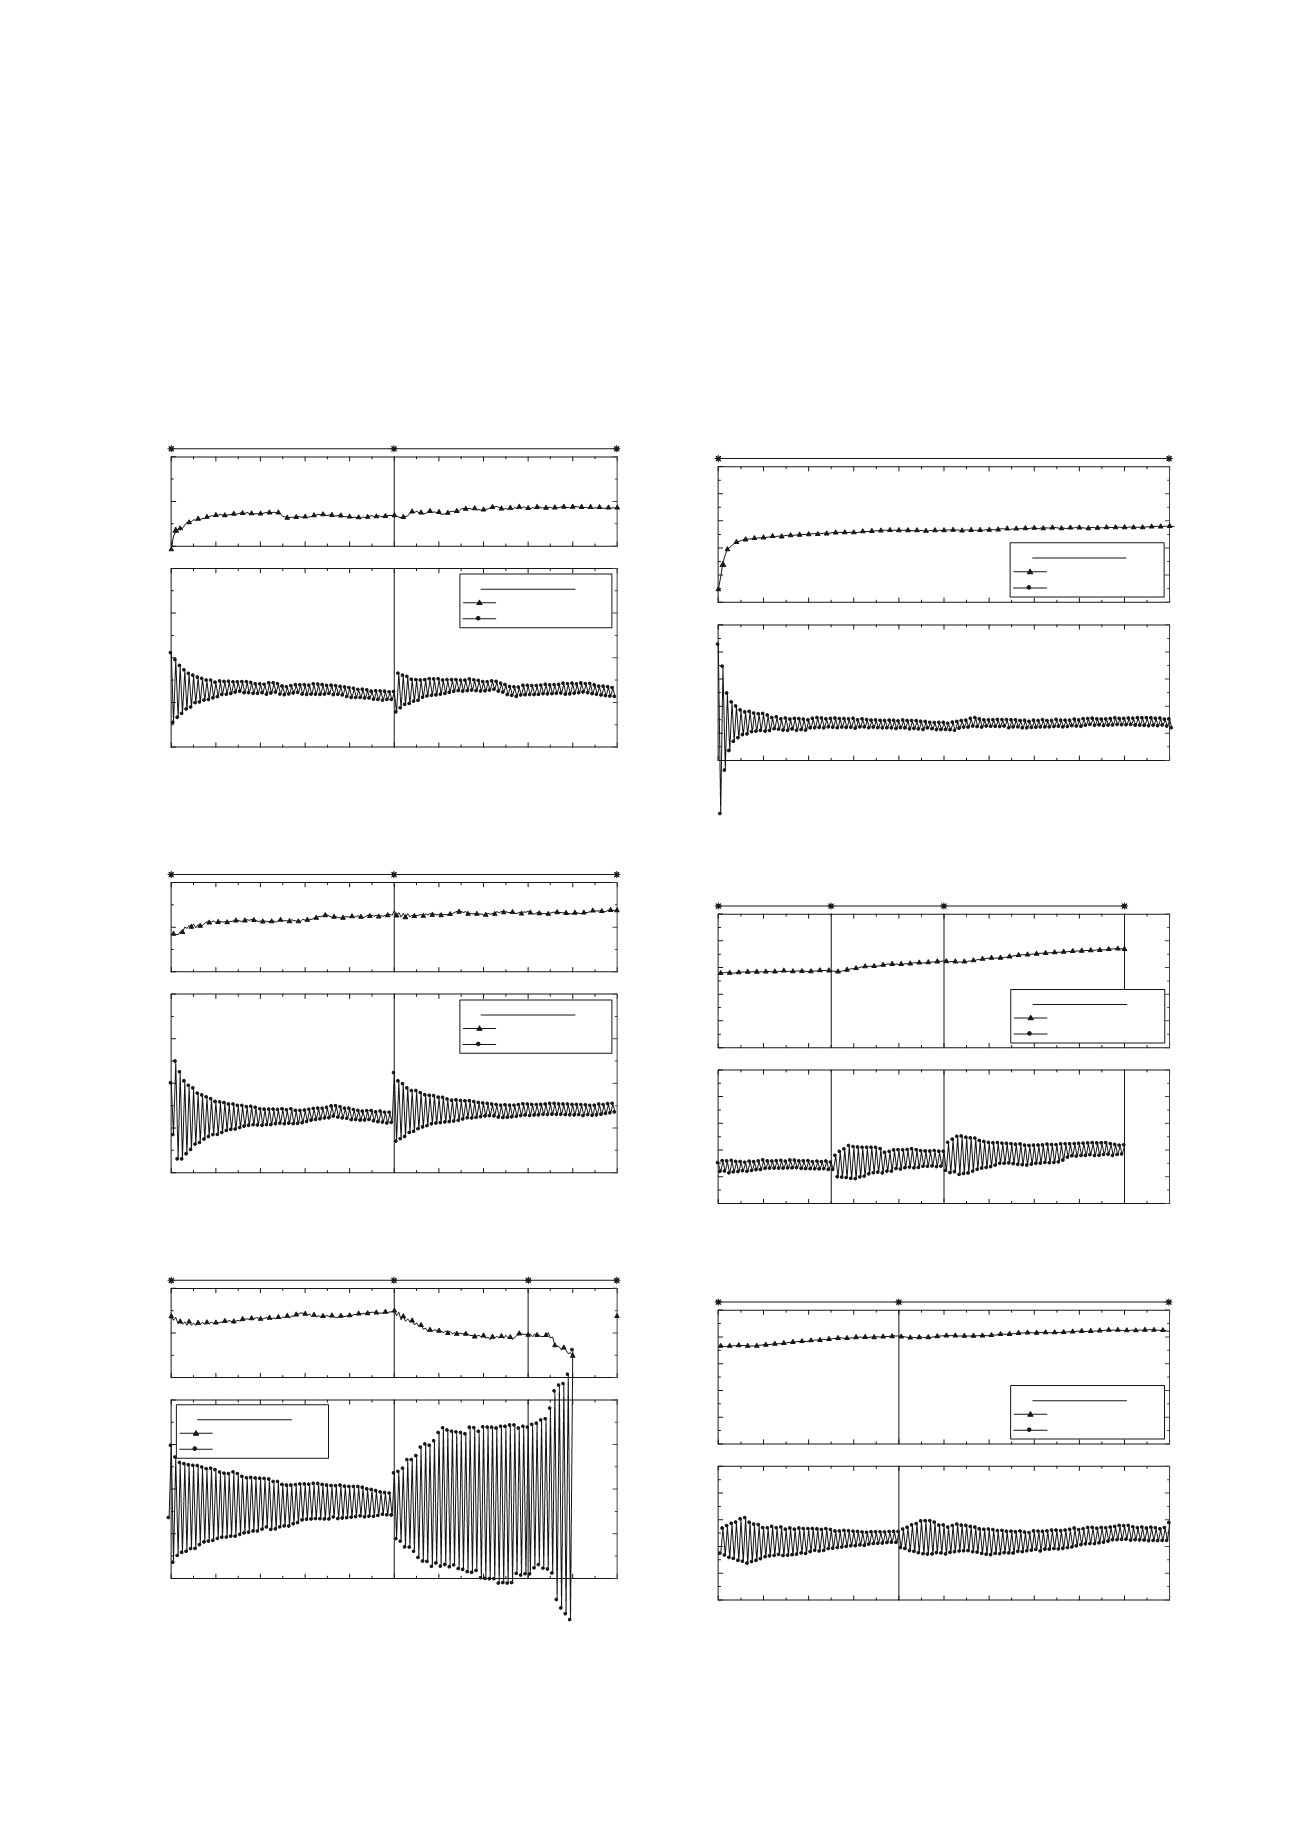
Figure 4. Effect of increasing the peak stress ratio on shear sand and
volumetric change (dense test).
100 110 120 130 140 150 160 170 180 190 200
No. of cycles
-1
0
1
2
3
s
0
1
2
v
(%)
100 110 120 130 140 150 160 170 180 190 200
R
max
=5.15
R
max
=4.71
(%)
Test no. : D-290
Volumetric strain
Shear strain
(b)
Figure 4. (Continued)
200 210 220 230 240 250 260 270 280 290 300
No. of cycles
-1
0
1
2
3
s
0
1
2
v
(%)
200 210 220 230 240 250 260 270 280 290 300
R
max
=6.27 R
max
=7.0
R
max
=5.67
(%)
Test no. : D-290
Volumetric strain
Shear strain
(c)
Figure 4. (Continued)
At this stage, if the sample experiences a higher peak stress
ratio, it again behaves hysterically and plastic strain develops.
The magnitude of the induced plastic strain and also the number
of cycles required for the sample to again attain an elastic state
are dependent on the magnitude of the new peak stress ratio
.
To investigate the influence of increasing the peak stress ratio
on stiffening behavior and volume change the results from tests
D-290 (dense sand) and L-433 (loose sand see Table 1) are
compared. In the case of dense sand, Figure 4, the test started at
a peak stress ratio of t/s=0.6 (R
max
=4) and it was increased when
an elastic state was observed. The values of
v
=-0.08% and
s
=1.1% when N=0 for dense sand (Test D-290, Figure 4) are
the corresponding values at the end of the initial monotonic
shear loading before commencing the cyclic stressing.
0 10 20 30 40 50 60 70 80 90 10
No. of cycles
0
0
1
2
3
4
5
s
0
2
4
6
8
10
v
(%)
0 10 20 30 40 50 60 70 80 90 10
R
max
=2.33
(%)
0
(a)
Test no. : L-433
Volumetric strain
Shear strain
Figure 5. Effect of increasing the peak stress ratio on shear sand and
volumetric change (loose test).
100 110 120 130 140 150 160 170 180 190 200
No. of cycles
0
1
2
3
4
5
s
0
2
4
6
8
10
v
(%)
100 110 120 130 140 150 160 170 180 190 200
R
max
=3.0
R
max
=3.71
(%)
(b)
Test no. : L-433
Volumetric strain
Shear strain
R
max
=3.44
Figure 5. (Continued)
190 200 210 220 230 240 250 260 270 280 290
No. of cycles
0
1
2
3
4
5
s
0
2
4
6
8
10
v
(%)
190 200 210 220 230 240 250 260 270 280 290
R
max
=4.0
(%)
(c)
Test no. : L-433
Volumetric strain
Shear strain
R
max
=4.33
Figure 5. (Continued)


