2728
Proceedings of the 18
th
International Conference on Soil Mechanics and Geotechnical Engineering, Paris 2013
have been carried out at End of Initial Drive (EOID) and, after
13 days, at Beggining of Resrtike (BOR) condition is selected to
study the different components contributing to the setup effects.
2 CONSTRUCTION SITE AND TESTS
Fajr II is a 32-hectar utility plant in PetZone of Mahshahr,
located in southwes Iran near Persian Gulf. The site
accommodates a power plant, pre-treatment and treatment water
units and air unit. Different types of precast and prestressed
driven concrete piles at a total of nearly 7000 points have been
constructed within the past three years. About 6000 points
include 450 mm outside diameter prestressed spun piles with a
wall thickness of 80 mm and closed-toe. The spun piles have
been driven with Kobe-35 and Kobe-45 diesel hammers, or
equivalents, down to embedment depths ranging between 14
through 22 m. The dominant soil layering across the
construction site is a very soft to stiff silty clay, average of 15 m
thick (layers I & II), overlain a medium dense to dense sand, 4
to 8 m thick (layer III). The pile tips are mostly embedded
within the sandy layer. Table 1 shows the geotechnical
parameters for construction site layers.
Nearly 5000 spun piles, 450 mm OD were driven to support
12 water tanks. Pile dynamic tests (PDA) and static load tests
were carried out on 30 test piles & 221 construction piles,
including, respectively, 54 & 251 PDA tests and 4 & 32
compressive static load tests. Static and PDA tests procedure
comply with general guidelines and specification of ASTM
D1143 and D4945, respectively. Some of the comparisons
between static and dynamic load tests are presented in
Fakharian et al. (2012). In fact about 5% of the construction
piles were PDA tested and average of 2 piles were static load
tested at each tank. With support of the test program, the factor
of safety was lowered to about 2 to 2.2 and sometimes as low as
1.8, that resulted in considerable savings compared to previous
projects in the region. The construction challenges and cost
savings are presented in more details by Fakharian et al. (2012).
Further information about tank details, test piles and
borehole location, pile arrangement and No. of construction pile
tests can be found in Sarrafzadeh et al. (2012).
The dominant soil layering in the 32-hectar site is highly
variable but classified in three layers, from top to bottom
respectively, layer 1 with 8 m thickness as soft clay, layer 2, 7
m thick as medium stiff to stiff clay, and layer 3, sand down to
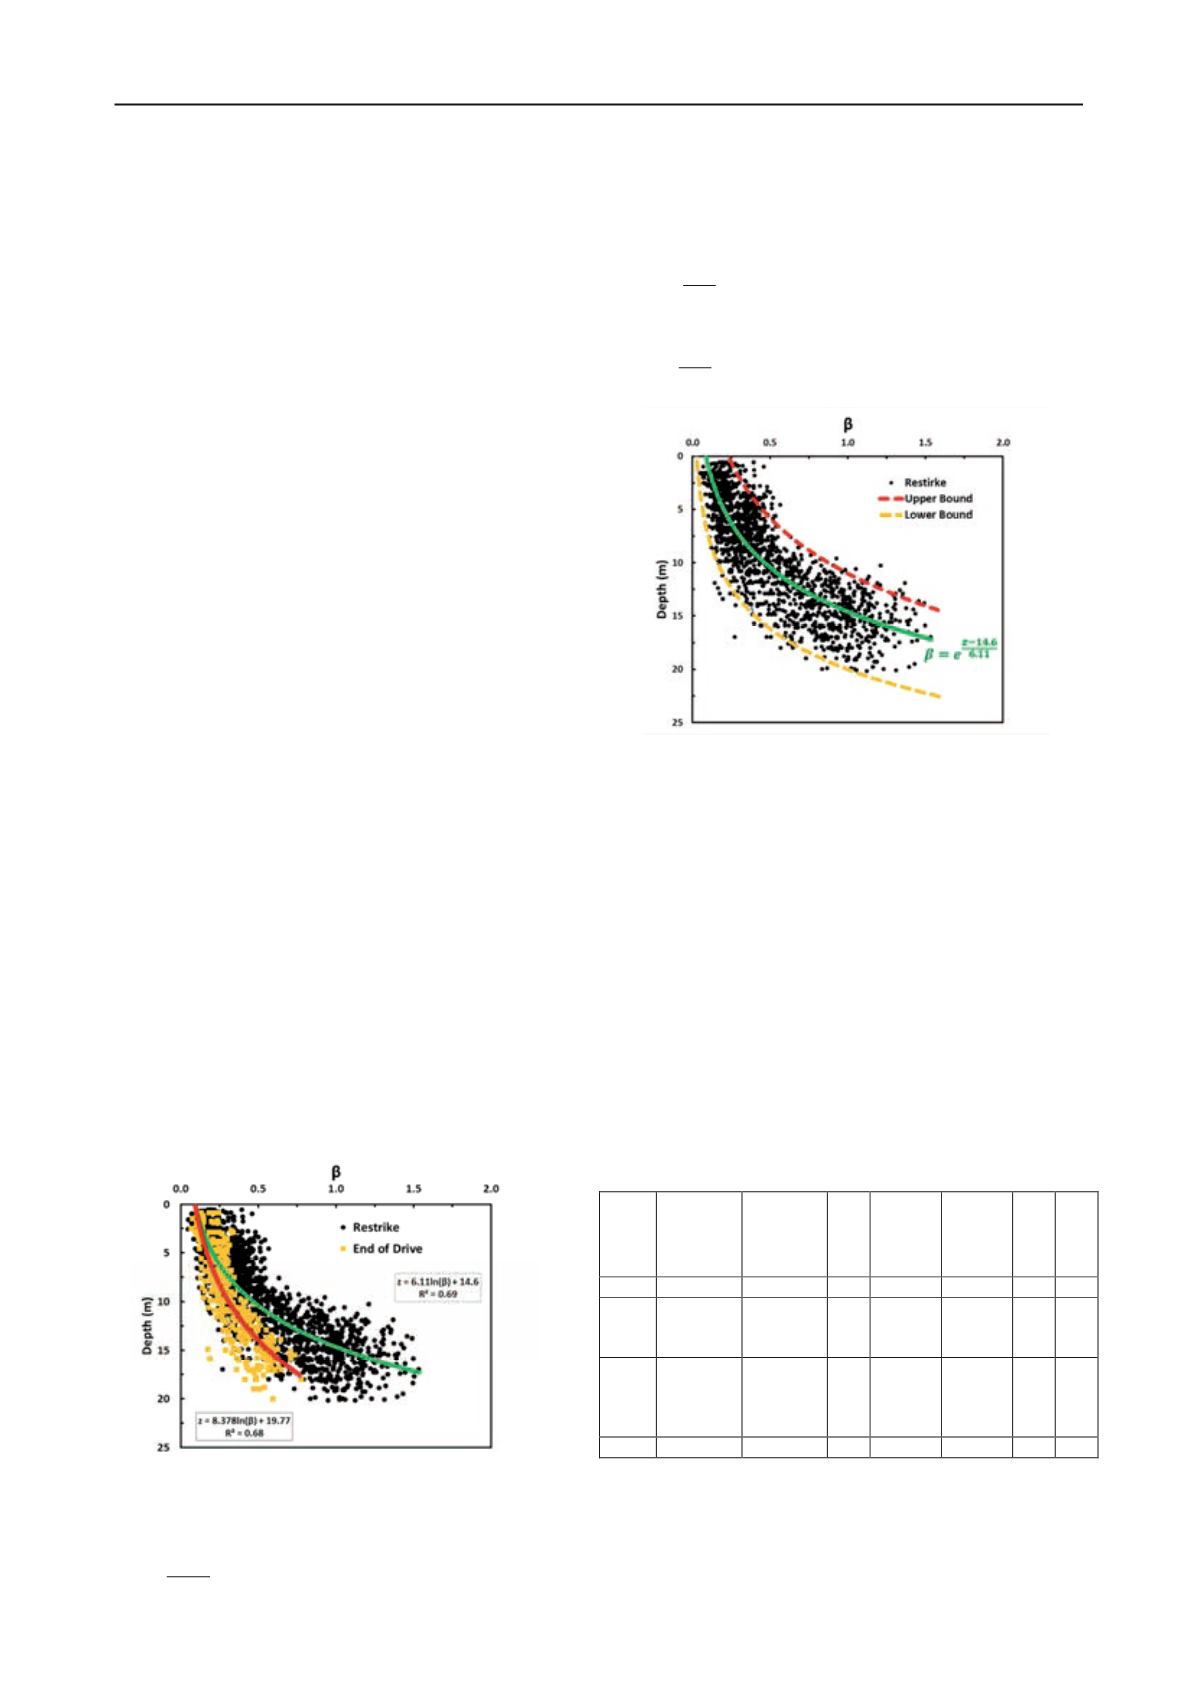
20 m. The incremental and cumulative shaft capacities from
CAPWAP analysis are available, from which,
β
-factor versus
depth is back-calculated. All the data points of five tanks were
put together and the results are presented in Fig. 1.
Figure 1.
β
variation with depth at EOD and Restrike for all tanks.
The lower and upper bounds of
β
-values and the average
trend lines are plotted in Fig.2. The average trend line can be
represented by empirical Eq. (1):
e
. .
in which, z (in m) is depth from ground surface.
Similarly, Eqs. (2) and (3) represent the upper bound,
β
, and
lower bound,
β
, respectively. The
β
parameter variation with
depth value is limited to 1.5 in all equations.
e
.
e
.
Figure 2. Mean
β
and lower and upper bounds at restrike.
3 NUMERICAL MODEL AND VALIDATION
Test pile No. 11 with 15.4 m embedment length is selected for
modeling, PDA test was performed at End of Initial Drive
(EOID) and, after 13 days, at Beggining of Resrtike (BOR)
condition. an elastic isotropic cylindrical pile with radius of
225.5 mm and 15.4 m length has been generated using the FEM
numerical package ABAQUS, in 2D axisymmetric condition.
Elasto-perfectly plastic model has been considered for the soil
material. Therefore, the required parameters for the elastic part
include elastic modulus, E, and Poisson’s ratio,
ν
, and Mohr-
coloumb strength parameters for the shear failure. The soil
surrounds the pile shaft with a radius of 5 m and length of 15.4
m. The brick soil elements have been generated 2.5x2.5cm
adjacent to the pile skin with gradual increase in size to reach a
maximum dimension of 2.5x12.5cm at the vertical boundary.
The pile shaft is simulated by 2.5x2.5cm solid elements. Table
1shows the specified parameters for both pile and soil material.
Table 1. Soil and pile parameters in numerical model (for TP 11)
The solid element CAX4RP has been used for which
simultaneous measurements of PWP and stress-strain are
possible. It is assumed that drainage is possible from the ground
surface only. Therefore, the top horizontal boundary was
specified as a zero pressure surface. Interface elements were
φ ̊
C (kPa)
K (m/s)
E (MPa)
γ‘
(kN/m
3
)
Depth
(m)
Soil type
Layer #
0
27
1×10
-9
20
10
0-7.4
Soft clay
I
0
27
1×10
-9
20-50
10
7.4-12.4
Medium
to stiff
clay
II
30
1
1×10
-8
50
10
12.4-15.4
Medium
dense to
dense
sand
III
-
-
-
20,000
14
15.4
Concrete
Pile
β 1.5
(1)
β 1.5
(2)
β 1.5
(3)


