2732
Proceedings of the 18
th
International Conference on Soil Mechanics and Geotechnical Engineering, Paris 2013
Proceedings of the 18
th
International Conference on Soil Mechanics and Geotechnical Engineering, Paris 2013
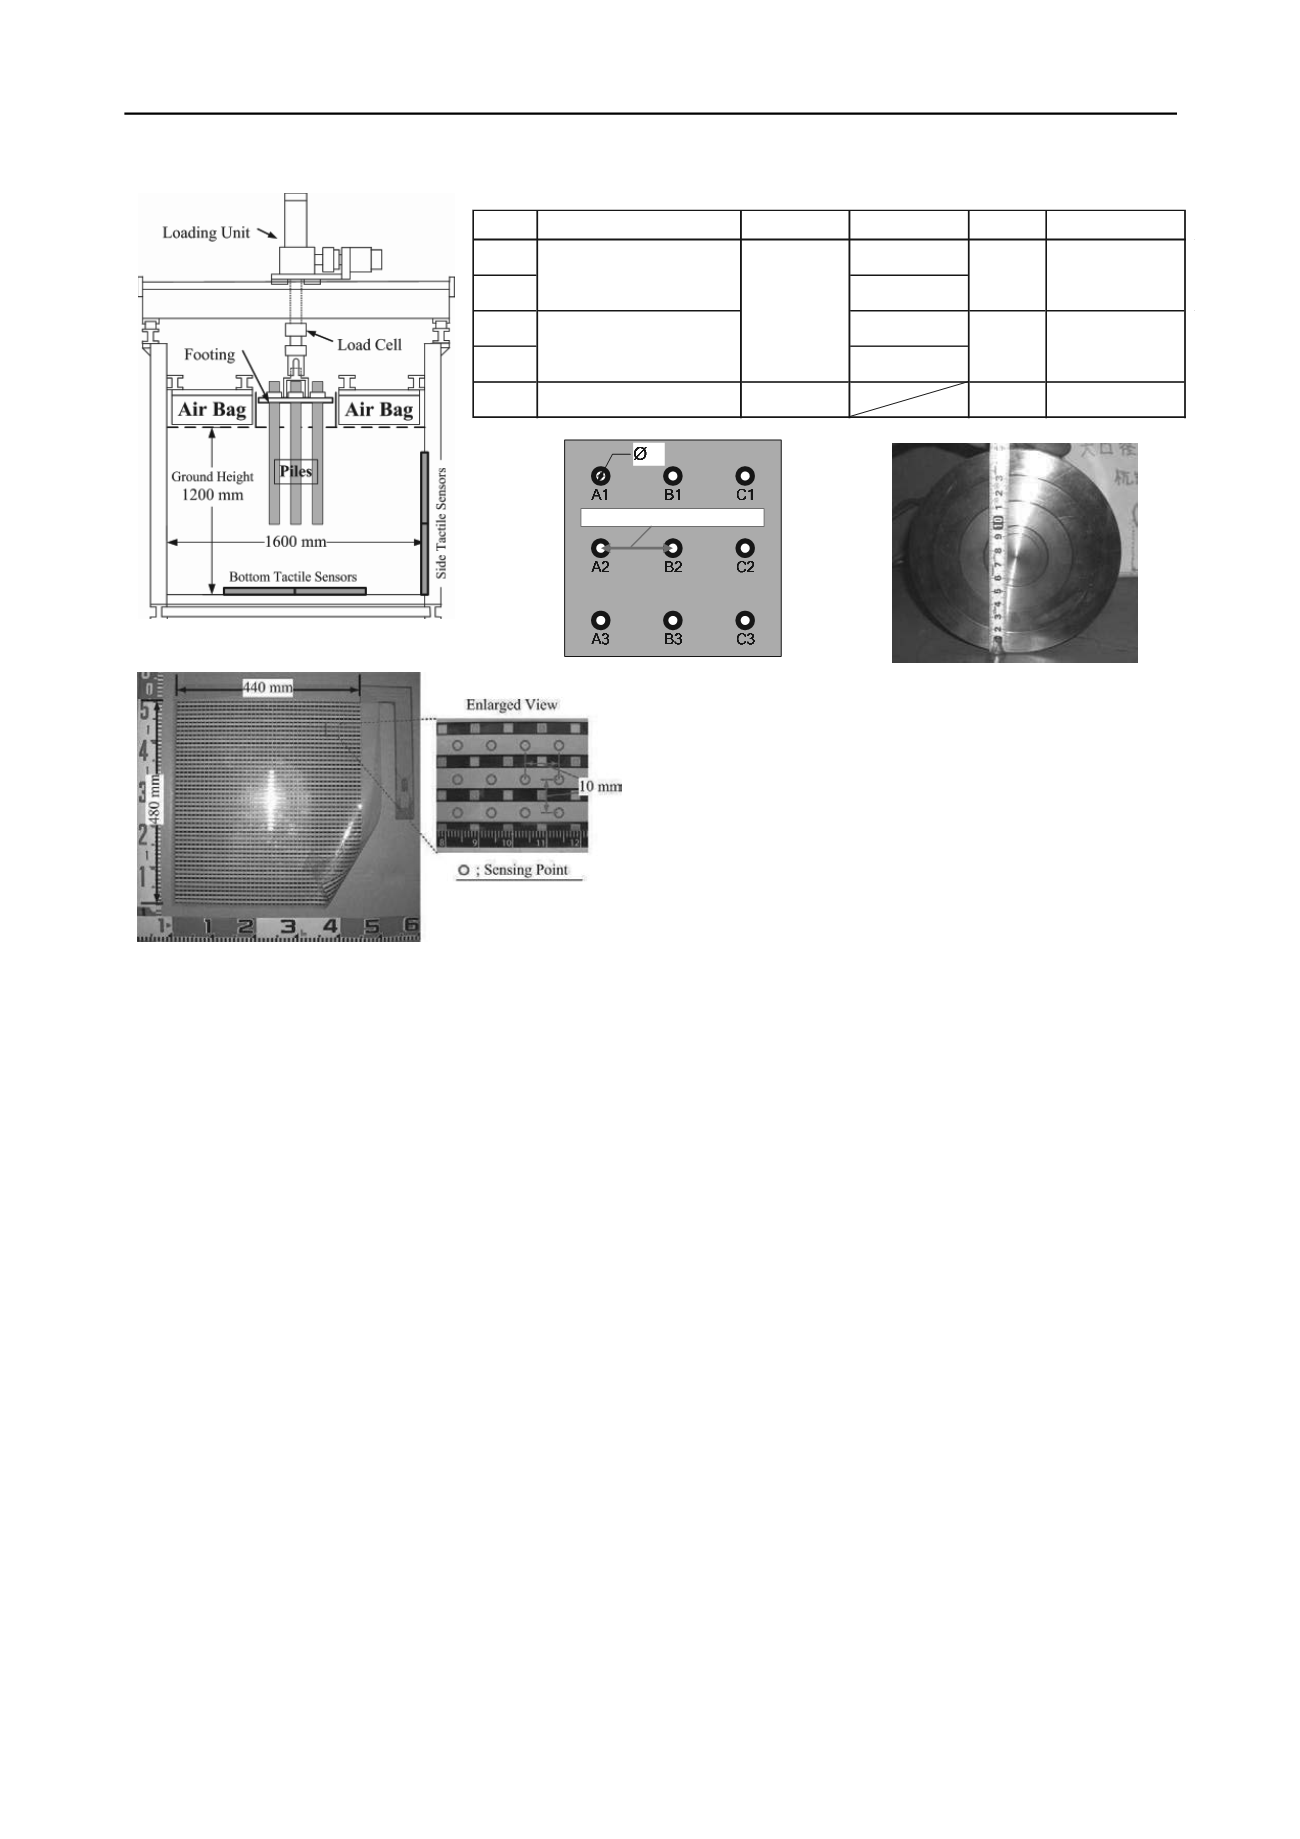
Figure 2. Tactile sensor sheet
Distance; 200mm or 100mm
Figure 3. Pile layout in a pile group
Figure 4. Annular load cells on the bottom
Case No.
Aim of the test
Number of piles
Pile Spacing Pile length Initial embeded depth
1
5.0 * D (200mm)
2
2.5 * D (100mm)
3
5.0 * D
4
2.5 * D
5
Loading test of the single pile
1
1000 mm
550mm
Loading test of the pile group
Veriticalpressure distribution
under the pile group loading
9
1000 mm
1300 mm
550mm
850mm
Table 1. All conducted tests conditions
Figure 1. Cross section of the test equipment
in parallel below the initial height of the pile tips to observe the
ground deformation after all loading tests were completed.
All conducted test conditions and main object of each test are
shown in Table 1.
The models of Case 1 to Case 4 were composed of 9
cylindrical piles as shown in Fig. 3. Each pile was made of
aluminum, 40mm in outer diameter, 4mm in thickness and
1000mm (Case 1 and Case 2) or 1300mm (Case 3 and Case 4)
in length. The bottom of the piles was closed by a flat plate.
Strain gauges were attached inside the piles at 5 levels along the
piles and each level had 4 strain gauges to measure both the
axial force and bending moments in two directions. Two kinds
of the center-to-center spacing between piles were adopted; 5.0
times the pile diameter (200mm) and 2.5 times (100mm).
The diameter of a single large pile in Case 5 was 150mm in the
outer diameter, while the thickness being 10mm and 1,000mm
in length. Area of the pile tip is 1.5 times the total area of 9 piles
in group piles. The strain gauges were attached inside at the
same elevation as in the case of group piles. Moreover, the
bottom of the large pile was closed by a load cell that was
divided into annular 4 rings as shown in Fig. 4 and the contact
pressures were measured individually by each ring.
After the ground was built up to le level of the pile tips, pile
models were set on the ground. The initial embedded depth is
shown in Table.1. Each head of pile in a group pile was fixed to
a steel plate that is called “footing” in Fig. 1. After setting the
models, the ground was built again up to 1200mm in height.
Group-pile loading tests were conducted in a displacement-
control manner; 0.1mm/min. The footing, to which each pile
was connected, was pushed down so that all piles would move
together into the ground. The confining pressure was increased
from 50kPa to 200kPa at an interval of 50 kPa. The loading
were performed till 30mm settlement under each confining
pressure, the loading was suspended at every 10mm settlement
to measure the pressure distribution by tactile sensors..
Additional loading tests were also performed on individual
piles before the group pile loading under each confining
pressure. The each head of 9 piles was pushed down without
any connection to the footing in the individual loading.
The single pile loading tests in Case 5 was also conducted in a
displacement-control manner but the loading rate was different
from that of the group pile; 0.2mm/min. Other conditions were
same as that of the group loading tests.
3 TEST RESULTS & DISUCUSSION
3.1
Load settlement curve and yielding point
Figure 5 shows the relationships between total bearing load
measured by at the top by the load cell and the settlement of the
footing. The pile spacing was 5.0D in Case 1 and 2.5D in Case
2. Irrespective of the pile spacing, the greater confining pressure
induced the greater bearing load. Although this was partially
caused by the increased stress level under higher confining
pressure, it is important as well that the ground below pile tips
had been compressed during the previous pile loading.
The inflection points of each curve, so called yielding points,
were marked by arrows in Fig. 5. The settlement at yielding
points when the pile spacing was 2.5D is greater than that of
5.0D spacing under each confining pressure. The settlement at
yielding point became slightly greater at the same pile spacing
when the confining pressure was increased.
Figure 6 shows the load-settlement curve until 20mm
settlement under the confining pressure of 100 kPa with both
pile spacing. The curve of the single pile loading tests with the
large diameter in Case 5 and the individual loading tests in Case
1 under the same confining pressure are also shown in the
figure. The yielding point of each curve was marked by the
arrow. The settlement at the yielding point became greater as
the pile diameter increased in case of the single or individual
loading. This implies that the settlement of a single pile would
increase if the diameter of pile becomes larger.
In comparison with the case of the single pile, the settlement
at the yielding point in the group pile of 5.0D spacing was
similar with that in the single pile of the small diameter; the
individual loading result in Case 1. On the other hand, the
settlement in the group pile of 2.5D spacing was similar with
that in the single pile of the larger diameter. These suggest that
the group pile of 2.5D spacing behaved as a unified group,
while each pile in the group pile of 5.0D spacing behaved
independently.


